Access the graph for which you want to specify the number of decimals for the vertical axis values.
Hint: You can also access a graph from the catalog.
In the upper-right corner of the workspace, select .
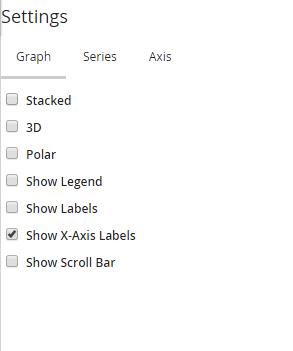
The Settings pane appears.

In the pane, in the Graph section, select the 3D check box.
The graph is refreshed to display in a three-dimensional view.
Hint: If you want to covert the graph to a two-dimensional view, clear the 3D check box.