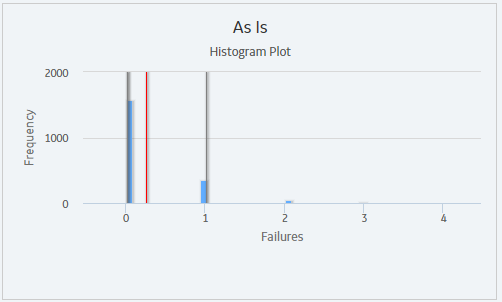
The Histogram Plot shows the distribution of the actual values from all iterations that were used to calculate the average value. The distribution of the actual values spreads across a series of data ranges, which are called bins and are represented by columns on the Histogram Plot. When an actual value from an iteration falls into a bin, it is included in the associated column. The higher the column is, the more values have fallen into the bin.

Note: The number of columns that appear in the Histogram Plot is determined by the value in the Histogram Bins field in the root System analysis.
Additional values are represented by the following lines in the Histogram Plot:
- Optimistic Value: Leftmost gray vertical line in the Histogram Plot. This line represents the lower level of the confidence interval.
- Average Value: Red line in the Histogram Plot. This line represents the mean value, which is the mean value of the values from the iterations of the Scenario.
-
Realistic Value: Blue line in the Histogram Plot. This line represents the median value, which is the median value of the values from the iterations of the Scenario.
Note: If the median value falls in between two values, then the larger value will be used as the Realistic value.
- Pessimistic Value: Rightmost gray vertical line in the Histogram Plot. This line represents the upper level of the confidence interval.