
Site Yield and CF
Access the Yield & CF TREND Section
The YIELD & CF TREND section contains a bar chart of the yield and capacity factor (CF) per day of a site. For information on how CF is calculated, refer to Capacity Factor and Yield.
Procedure
- In the Capacity Factor & Yield section, select
 .The Yield & CF Trend section appears, displaying the CF (in percentage) and yield (in kWh/kWp) values in a bar chart. Above the graph, the CF and yield values for today are displayed.
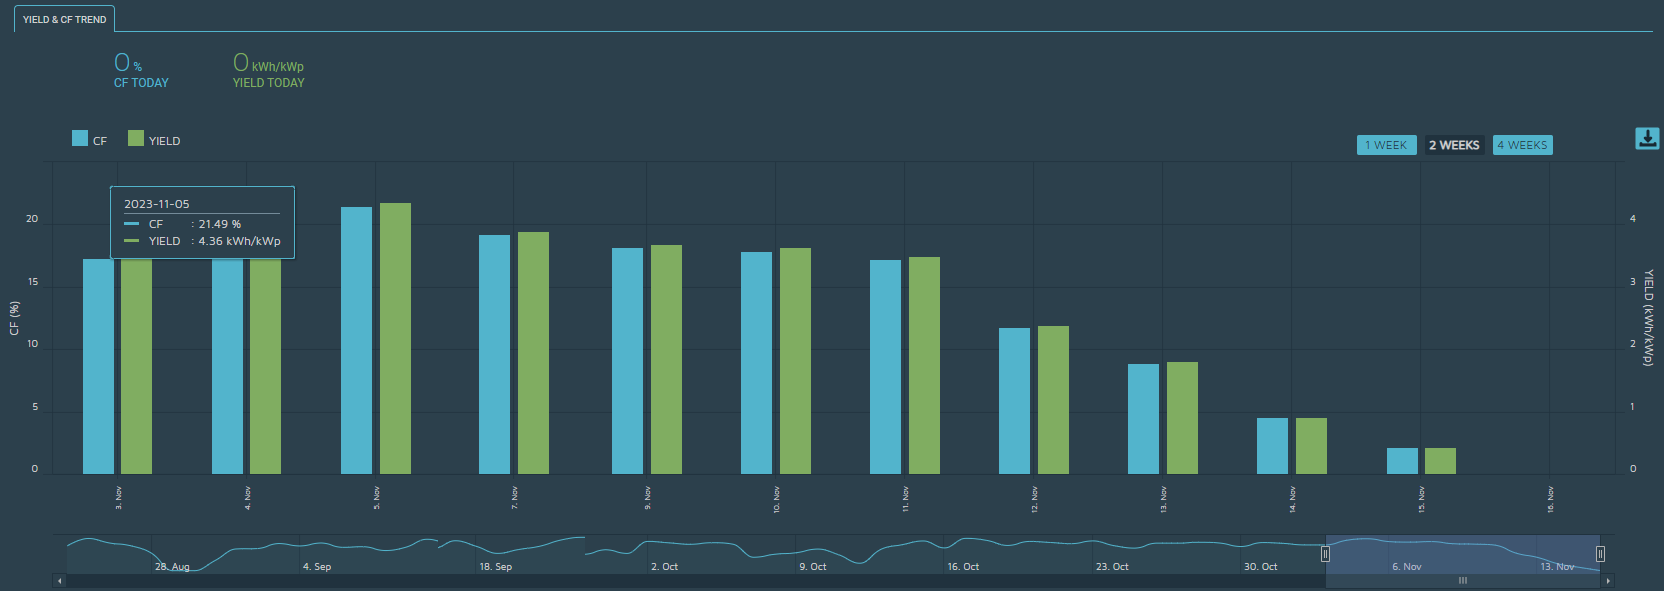
- To download the data into a PNG or a CSV file, select
 , and then select the required format.