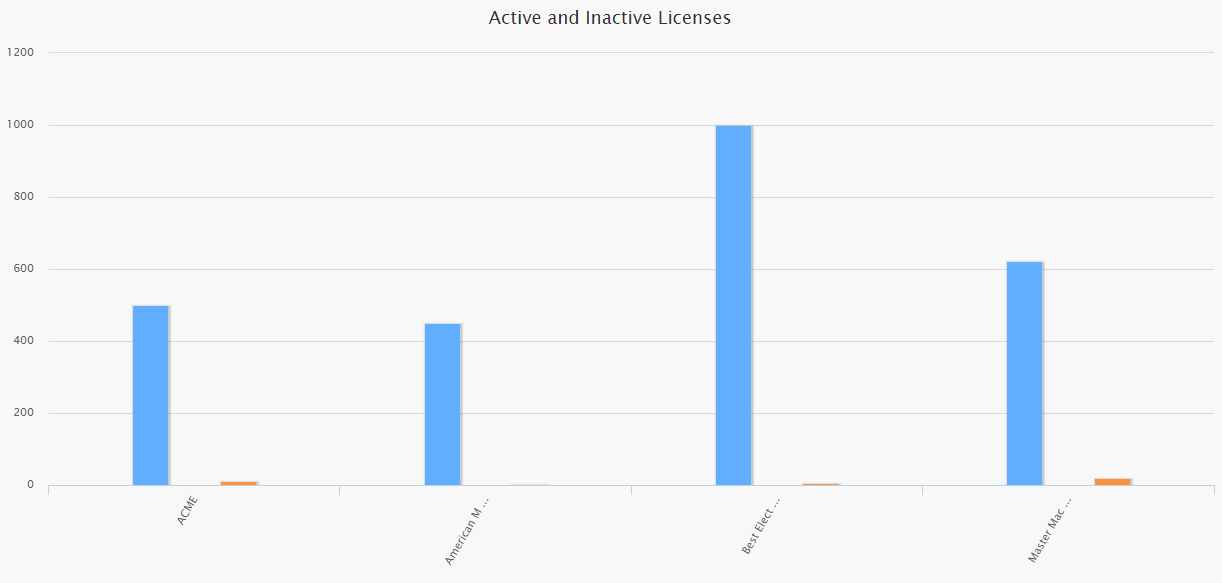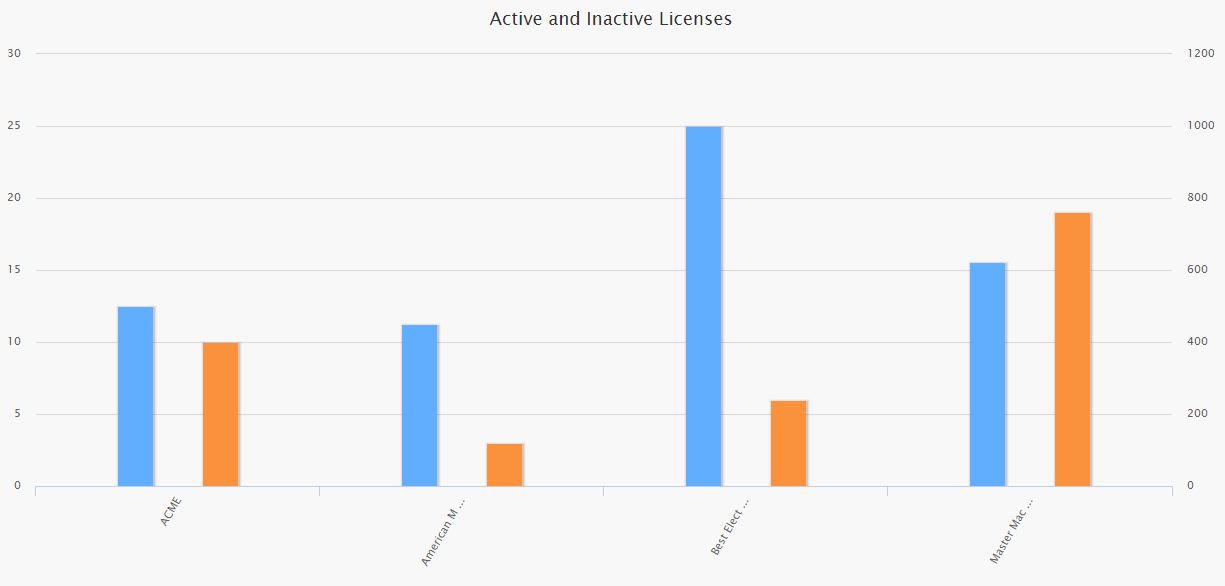
The Data Source workspace displays a list of the columns or fields that exist in the underlying query or dataset. The graph dimensions will adjust automatically based on your settings.
Consider a query with the following results:
| Manufacturer | Active Licenses | Inactive Licenses |
|---|---|---|
| ACME | 500 | 10 |
| American Motors | 450 | 3 |
| Best Electric | 1000 | 6 |
| Master Machinery | 623 | 19 |
A graph that you build from this query could display the active licenses, as shown in the following image:

...or both active and inactive licenses for each manufacturer, as shown in the following image.

Copyright © 1993-2015 Meridium, Inc. All rights reserved.