Sample Analytics
Sample Analytics
Download and test sample analytics using KBA 000071062.
Generate Analytic with Alerts
Steps to upload and deploy a sample analytic with alerts on Predix runtime.
Before You Begin
- You have uploaded the required assets, tags and time series data required for this analytic.
- Your tenant's Event Hub is also registered with the Essentials Alert service.
- You are signed into an tenant with access privileges to manage analytics on Predix runtime.
- You have downloaded the copy of the sample analytics using KBA 000071062.
Procedure
Essentials Port to Field Map for Predix Analytics
An analytics port-to-field map simply creates a mapping derived from the analytic template configuration such as input definitions, output definitions, and output events to tell the runtime engine to connect to the respective data sources to fetch inputs and write outputs. The port-to-field map is itself a JSON structure.
Type: PortToFieldMap
See the following table for a description of the elements in a PortToFieldMap.
| Field | Description |
|---|---|
analyticName | Template name as defined in Essentials. |
analyticVersion | Analytic version provided at the time of analytic upload or creation. |
comment | (Optional) Informational only. |
orchestrationStepId | Applies to analytic orchestration. It is an auto generated ID for the orchestration step. |
iterations | Supports multiple iterations for the same analytic. Creates an entry per iteration. |
Example PortToFieldMap JSON
The following example .json represents the port to field map data for per port time series array.
{
    "comment": [
        "/pxDeployments/23dabd15-ea98-47ba-aec5-c8adb59b630d",
        "e3692835-411b-4a1a-82cb-c88e73f98c53",
        ""
    ],
    "analyticName": "Shared_timestamp_sample_analytic",
    "analyticVersion": "1.0.0",
    "orchestrationStepId": "sid-fb5e38a2-c5fe-4f8a-84d8-2428d7f7361a",
    "iterations": [
        {
            "id": "0",
            "inputMaps": [
                {
                    "valueSourceType": "DATA_CONNECTOR",
                    "fullyQualifiedPortName": "data.time_series.input1",
                    "fieldId": "Shared_timestamp_sample_analytic_DeploymentStep1_1_input_input1",
                    "queryCriteria": {
                        "start": "${START_TIME}",
                        "end": "${END_TIME}"
                    },
                    "dataSourceId": "PredixTimeSeries"
                },
                {
                    "valueSourceType": "DATA_CONNECTOR",
                    "fullyQualifiedPortName": "data.time_series.input2",
                    "fieldId": "Shared_timestamp_sample_analytic_DeploymentStep1_1_input_input2",
                    "queryCriteria": {
                        "start": "${START_TIME}",
                        "end": "${END_TIME}"
                    },
                    "dataSourceId": "PredixTimeSeries"
                },
                {
                    "valueSourceType": "CONSTANT",
                    "fullyQualifiedPortName": "data.constants.threshold",
                    "value": 10
                }
            ],
            "outputMaps": [
                {
                    "fullyQualifiedPortName": "time_series.output1",
                    "fieldId": "Shared_timestamp_sample_analytic_DeploymentStep1_1_output_output1",
                    "dataSourceId": "Temporary,PredixTimeSeries"
                },
                {
                    "fullyQualifiedPortName": "time_series.output2",
                    "fieldId": "Shared_timestamp_sample_analytic_DeploymentStep1_1_output_output2",
                    "dataSourceId": "Temporary,PredixTimeSeries"
                }
            ],
            "inputModelMaps": []
        }
    ]
}
Sample Data Map for Analytic Outputs
| This JSON file | Is related to this |
|---|---|
| <asset_sourcekey>.json | Output of the analytic execution data and the status of the deployment execution. Note: You can receive multiple files in the ZIP file. |
<asset_sourcekey>.json
The <asset_sourcekey>.json file comprises execution parameters, execution status, and alerts and time series data output given by the analytic. There is one <asset_sourcekey>.json file for each asset for which the analytic has been executed.
| JSON | |
|---|---|
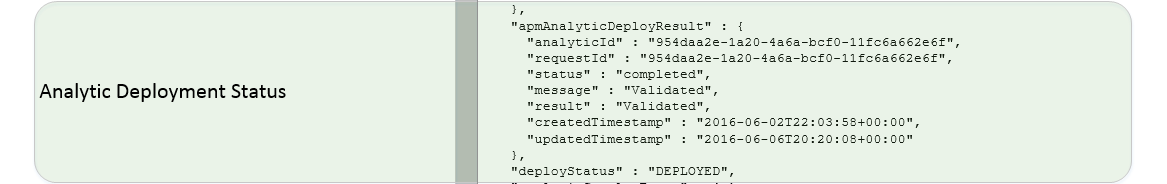
| Deployment Metadata |
|
| Output Metadata |
|
| Output Alerts |
|
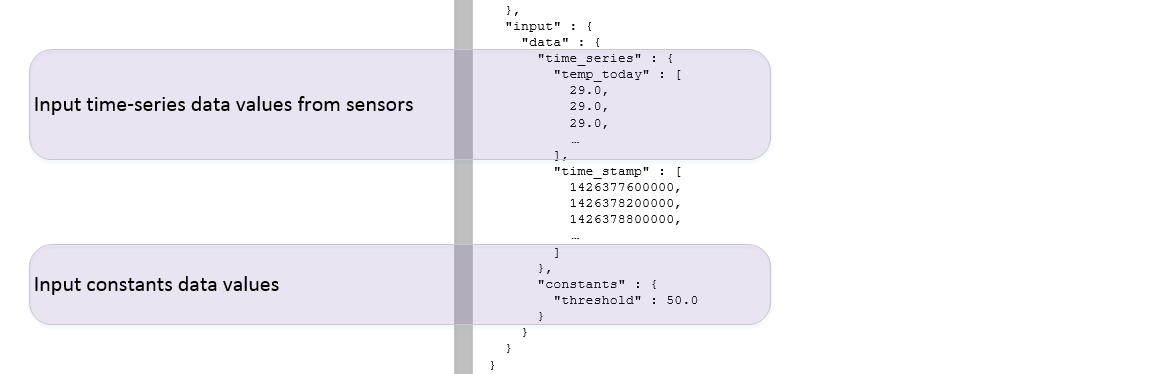
| Output Timeseries |
|
The date, score, and sensor blocks are related. The first elements from these three blocks are used to create the first alert; the second elements are used to create the second alert, and so on.
The time_stamp block is related to all other blocks in the time_series block. The first element in the mean block corresponds to the first element in the time_stamp block; the second element in the mean block corresponds to the second element in the time_stamp block, and so on.
For each entry in the mean block, there is one entry in the time series database. The tag id for each data point is in the <asset_sourcekey>.<analytic_name>.<output_def_name> format.
For example, for the values [asset_sourcekey = 399, analytic_name = "analytic1", output_def_name = "mean"], the tag id is "3999.analytic1.mean".
output_def_name = "mean", asset_sourcekey = 3999, analytic_name = "analytic1":| tagId | timestamp | value |
|---|---|---|
| 3999.analytic1.mean | 1430829000000 | 33.380000000000003 |
| 399.analytic1.mean | 1430761000000 | 47.0 |
| ... | ... | ... |
Similarly, there are data point entries for the deviation block as well.
- PROCESSING
- DEPLOYED
- FAILED