SmartSignal Deployments

Access the Processing Status of SmartSignal Analytic Instances

You can use the SmartSignal Deployments page to access the processing statuses of analytic instances in your system.

Procedure

  1. In the Applications menu, navigate to the RELIABILITY section, and then select SmartSignal Deployments.
  2. Select a number above one of the following headings:
    • Not Processing
    • Partial Processing
    • Successfully Processing
    • Not Loading
    • Not Active
    The grid displays processing details for the analytic instances in the category you selected.
    Tip: You can select the name of an analytic instance on this page to access the selected instance in the SmartSignal Maintenance module.
  3. Optional: By default, the page refreshes automatically every five minutes. However, if you want to modify the refresh interval, choose one of the following options:
    ChoiceDescription
    Manually refresh the pageIf you want to manually refresh the page, select Refresh.
    Modify the refresh intervalIf you want to modify the interval at which the page refreshes, select an interval in the box next to the Refresh button.
  4. Optional: To access events related to an analytic instance:
    1. Select an instance in the first table.
      Details for the selected instance are populated automatically in the second table.
    2. As needed, in the date filter boxes, select a date range for which you want to access events.
    3. Select Search Events.
      The second table on the page displays details of the events related to the selected analytic instance.
  5. Optional: If you want to export a .csv file containing the processing status of analytic deployments in your system, select Export.
  6. Optional: If your tenant is configured with the SmartSignal Model Personalization feature enabled, an additional tab Blocked Jobs is displayed. This tab allows you to view any model personalization job that was blocked from completing due to one of the following conditions:
    • A user has the analytic instance locked for editing.
    • There are active alerts for the analytic instance.
    • A dependent service is unavailable .
    • The amount of training data being added to the model would cause it to exceed the supported limit (i.e. >55k).

Configure Email Notification Preferences

Before You Begin

Make sure that the tenant is configured to send the analytic processing notification. If the tenant is not configured to send the notification, contact your Analytic administrator to configure the email notification settings for the tenant.

About This Task

You can configure email notification preferences to receive email notifications about tenant analytics processing. If you are already subscribed to receive the notifications, you can modify the preferences to stop receiving the notifications. Based on the configuration done by your Analytic administrator, you can receive notifications about analytics that are:
  • Successfully Processing
  • Partial Processing
  • Not Processing
  • Not Loading

Procedure

  1. In the Applications menu, navigate to the RELIABILITY section, and then select SmartSignal Deployments.
  2. In the Actions box, select Email Notification Preferences.
    The Email Notification Preferences window appears.
  3. Select Subscribe.
    You are subscribed to receive email notification containing information about tenant analytics processing.
    Note: If you are already subscribed to receive the email notification, the Email Notification Preferences window provides you the option to Unsubscribe from the notification.

Validate Analytics with Asset Tags

About This Task

You can validate the status of the Analytic Instance Asset Tag configuration. This report identifies any SmartSignal analytic instance where one of the following conditions is detected:
  • A time series link in the analytic data source is different from the link defined in the associated APM Asset tag.
  • A tag alias was not found in the input-output mapping of the analytic.
  • A tag alias was not found in the associated APM Asset tag list.
  • The UOM defined in the SmartSignal Analytic Instance was not compatible with the UOM defined in the associated APM Asset tag.

Procedure

  1. In the module navigation menu, go to SmartSignal Deployments.
  2. In the Actions box, select Validate Analytics with Asset Tags.
    The Validate Analytics with Asset Tags window appears.

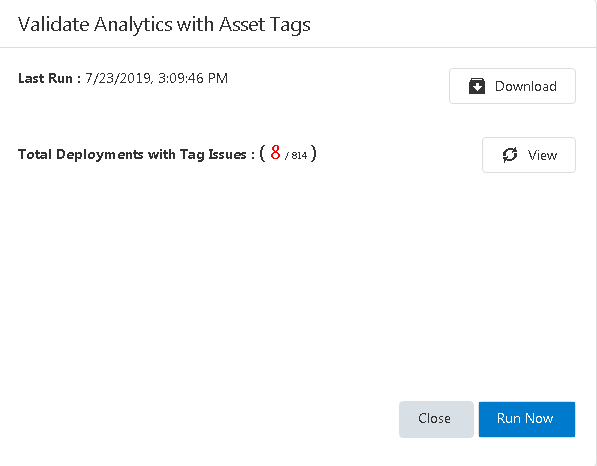
    Note: The Last Run box contains the date and time when the latest asset tag view was updated.
  3. Select Run Now to create or update the view.
    The job starts and a progress indicator appears in the window.
  4. After the report is generated, select Download to get the result in detail.
    The report is downloaded in a .csv format. The report contains the columns that are described in the following table.
    Column NameDescription
    Analytic IDAnalytic instance name.
    Active

    True: Analytic instance is active.

    False: Analytic instance is not active.

    Deployed

    True: Analytic instance is deployed.

    False: Analytic instance is not deployed.

    Tag NameAnalytic instance tag alias.
    Source Tag NameAnalytic instance source tag name.
    APM TagTag name in the I/O map.
    Timeseries LinkTimeseries link specified in the APM Asset Tag.
    Has IO Mapping

    True: Tag was found in the I/O map.

    False: Tag was not found in the I/O map.

    APM Asset Tag

    True: The APM Asset Tag was found.

    False: The APM Asset Tag was not found.

    Source Tag In Sync

    True: Source tag in the analytic matches the time series link in the APM Asset tag.

    False: Source tag in the analytic does not match the time series link the APM Asset tag.

    Can be fixed

    True: The issue can be fixed using the Update input tags button.

    False: The issue cannot be fixed automatically.

  5. Select View to access the list of analytic instances that have been flagged by the job.
    The Validate Analytics with Asset Tags – Issues Found window appears, displaying the list of analytic instances that were identified.

  6. Select the analytic instance that you want to view and resolve the configuration issue.
  7. Select Close after the review is completed.