
Fleet Overview
Access the FLEET OVERVIEW Page
The FLEET OVERVIEW page contains the geolocation map of the sites being monitored in the fleet, along with a summary of KPIs of the sites in the fleet. These sites are indicated by a color code, which helps you identify sites with issues. It also helps you check the overall health of the fleet.
Procedure
In the Applications menu, select .
- The geolocation map: Contains the geolocation map of the solar sites that are monitored in the fleet. Each site is indicated by the image of a solar panel with one of the following colors:
- Green: Indicates that the site is healthy; none of the inverters report critical issues or warnings.
- Yellow: Indicates that the site contains inverters with warnings.
- Red: Indicates that the site contains inverters with critical issues.
- White: Indicates that the site is not communicating or that data is not available for the site for the past 60 minutes.
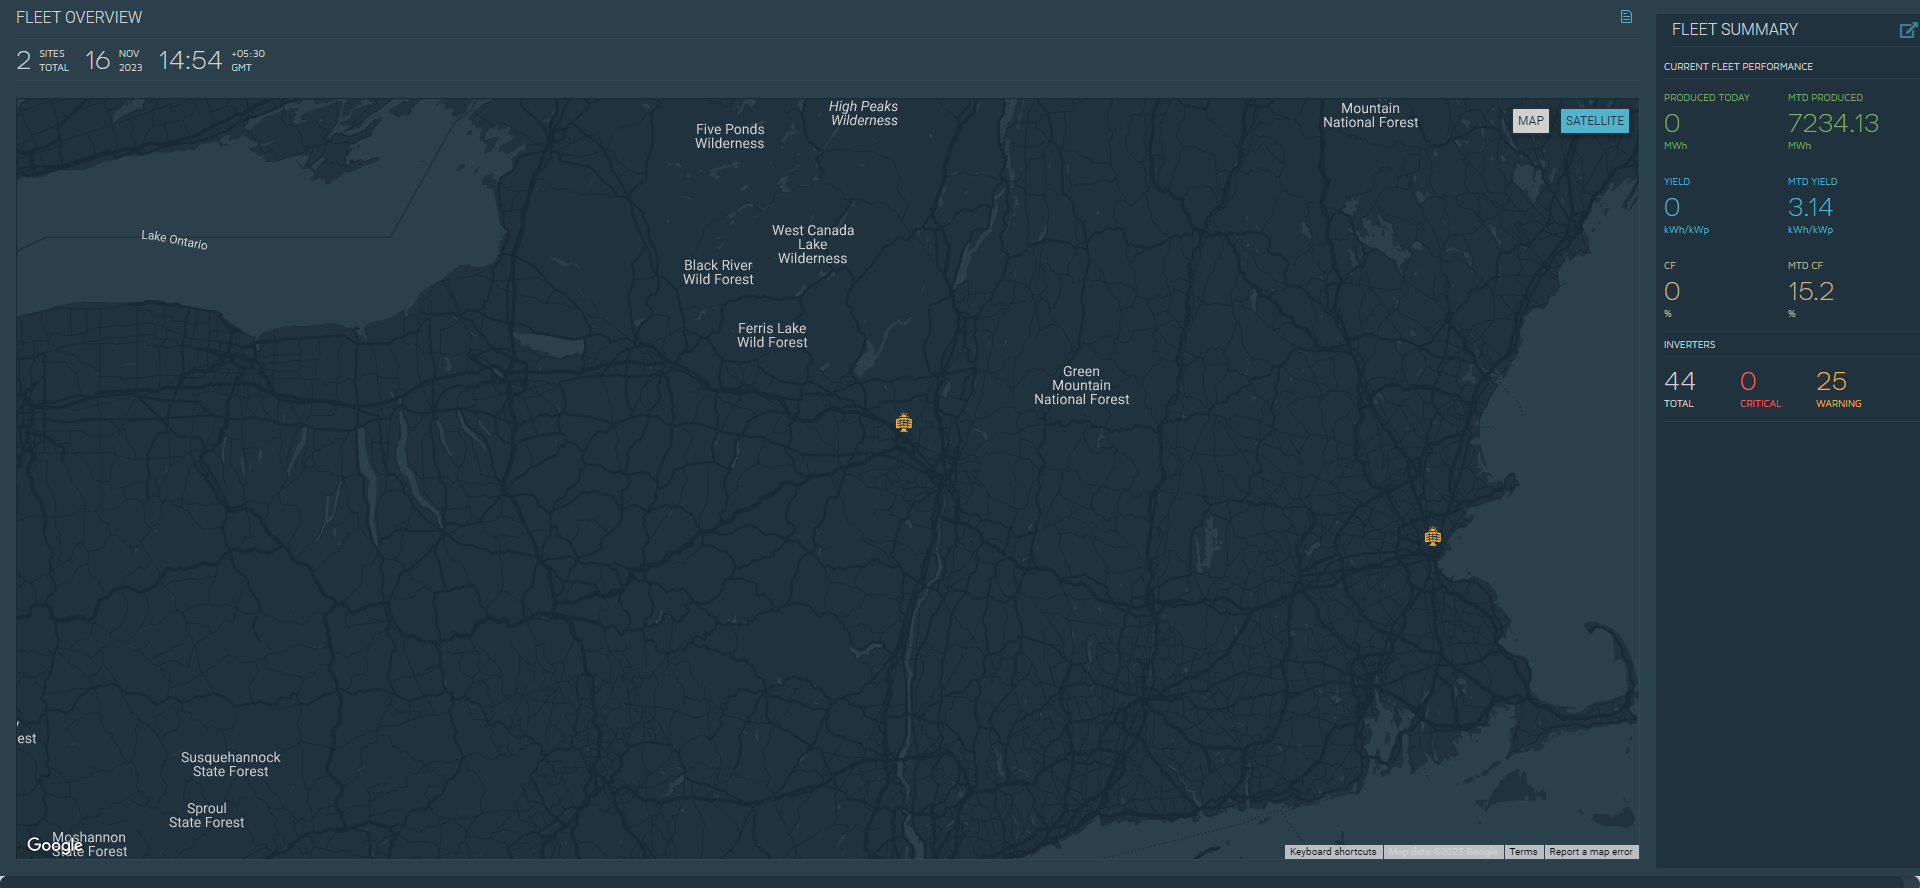 If you pause over a site, the KPIs of the site appear. If you select a site, the OVERVIEW section for the site appears.
 - The FLEET OVERVIEW section: Contains the total number of sites being monitored in the fleet and the current timestamp.
- The FLEET SUMMARY section: Contains the key performance indicators (KPIs) of the fleet (such as the energy produced today, the total MTD of all sites in the fleet, and the yield, MTD yield, capacity factor (CF), and MTD CF, which represent the site AC capacity weighted averages). This section also contains the total number of inverters, split up based on the severity of issues.
Access the PRODUCTION SUMMARY Section
The PRODUCTION SUMMARY section contains a bar chart of the actual and expected energy production of each site in the fleet.
Procedure
- In the FLEET SUMMARY section, select
 .The PRODUCTION SUMMARY section appears, displaying a bar chart of the expected and actual energy production of the sites in the fleet.
If you pause over a bar in the chart, the actual and expected energy production of the site appears.
- To download the data into a PNG or a CSV file, select
 , and then select the required format.
 - To access the data is a tabular form, select
 .To download the data into a PNG or a CSV file, select
 , and then select export all data.
To add or remove columns, freeze a column to the left, or change the order of the columns, select
 , make the required changes, and then select APPLY.
Access the LOSS BREAKDOWN ANALYSIS section of a Fleet
The LOSS BREAKDOWN ANALYSIS section of a fleet contains the output of the loss breakdown analysis of the inverters in the fleet, plotted based on the loss type and inverter. This machine-learning model identifies and categorizes various losses by comparing the AC power of inverters along with the site irradiance.
Procedure
- In the FLEET SUMMARY section, select .The PRODUCTION SUMMARY section appears.
- Select LOSS BREAKDOWN ANALYSIS.The LOSS BREAKDOWN ANALYSES section appears, displaying the following charts:
- TOTAL LOSS BREAKDOWN BY LOSS TYPE: Displays the loss of all inverters in the fleet for each loss type, along with the total loss. The following loss types are plotted:
- Inverter Derate: Identifies the loss when an inverter output is derated compared to the remaining inverters.
- Inverter Dip: Identifies the loss when an inverter output suddenly dips even though the irradiance is normal.
- Inverter Down: Identifies the loss when an inverter trips.
- Inverter Late Start: Identifies the loss due to late start of an inverter compared to the remaining inverters.
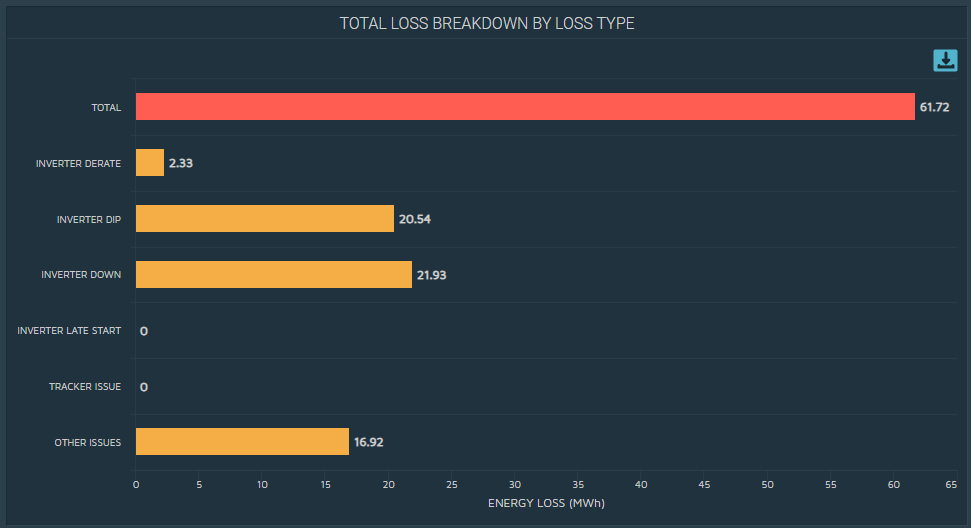 Note: If most of the inverters have similar AC power signature, losses may not be identified.The first bar displays the total loss.
If you pause over a bar in the chart, the top five contributors to the loss type appears.
- TOTAL LOSS BREAKDOWN BY INVERTER: Displays the total loss of each inverter in the fleet in a pie chart.

If you pause over a pie section in the chart, the breakdown of the corresponding loss type of the inverter appears.
- TOTAL LOSS BREAKDOWN BY LOSS TYPE: Displays the loss of all inverters in the fleet for each loss type, along with the total loss. The following loss types are plotted:
- To download the data into a PNG or a CSV file, select , and then select the required format.