
Site Production
Access the PRODUCTION TREND Section
The PRODUCTION TREND section contains a trend chart of the production data in a site.
Procedure
- In the PRODUCTION section, select
 .The PRODUCTION TREND section appears, displaying the historical production data in a trend chart for the following values:
- AC power
- DC power
- Expected power
- Average POA
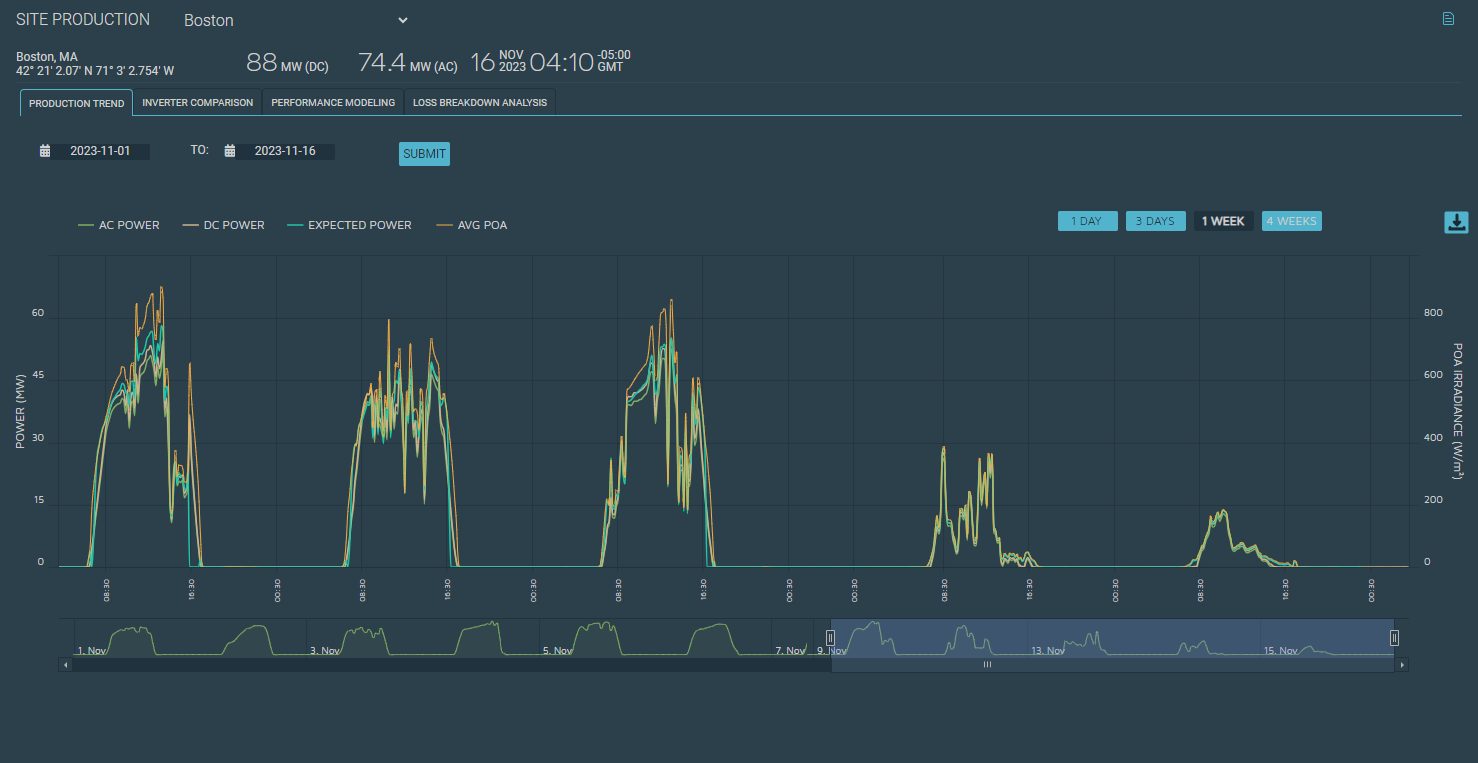
If you pause over a point in the chart, the production data at that point in time appears.
- To download the data into a PNG or a CSV file, select
 , and then select the required format.
Access the INVERTER COMPARISON Section
The INVERTER COMPARISON section allows you to view the top 10 and least 10 performers among all the inverters. You can also view the trend chart of a selected metric for inverters.
Procedure
- In the PRODUCTION section, select .The PRODUCTION TREND section appears.
- To download the data into a PNG or a CSV file, select , and then select the required format.
Access the PERFORMANCE MODELING Section
The PERFORMANCE MODELING section contains a chart of actual and expected production data. It uses a digital twin to calculate the expected production of a site (based on the actual weather and site setup).
Procedure
- In the PRODUCTION section, select .The PRODUCTION TREND section appears.
- To download the data into a PNG or a CSV file, select , and then select the required format.
Access the LOSS BREAKDOWN ANALYSIS Section
The LOSS BREAKDOWN ANALYSIS section contains the output of the loss breakdown analysis, plotted based on the loss type and inverter. This machine-learning model identifies and categorizes various losses by comparing the AC power of inverters along with the site irradiance.
Procedure
- In the PRODUCTION section, select .The PRODUCTION TREND section appears.
- Select LOSS BREAKDOWN ANALYSES.The LOSS BREAKDOWN ANALYSES section appears, displaying the following charts:
- TOTAL LOSS BREAKDOWN BY LOSS TYPE: Displays the loss of all inverters for each loss type, along with the total loss. The following loss types are plotted:
- Inverter Derate: Identifies the loss when an inverter output is derated compared to the remaining inverters.
- Inverter Dip: Identifies the loss when an inverter output suddenly dips even though the irradiance is normal.
- Inverter Down: Identifies the loss when an inverter trips.
- Inverter Late Start: Identifies the loss due to late start of an inverter compared to the remaining inverters.
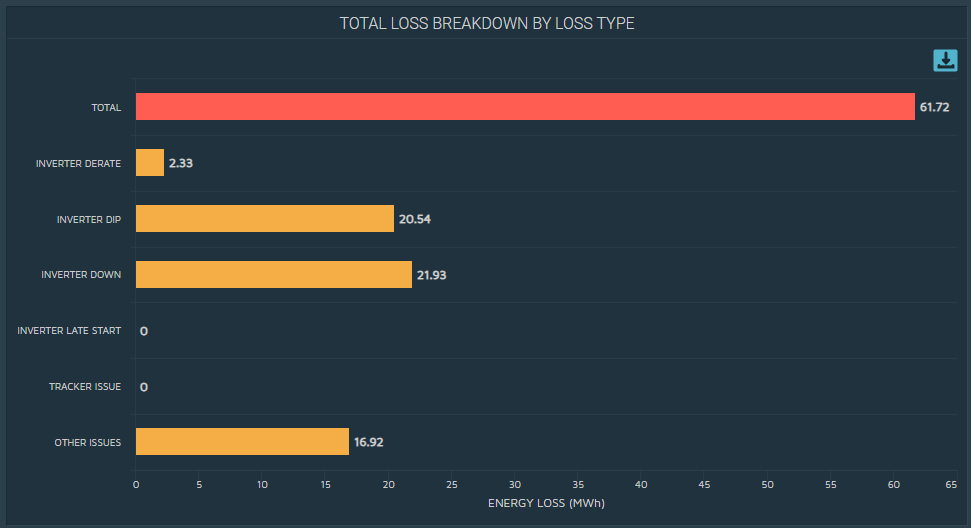 Note: If most of the inverters have similar AC power signature, losses may not be identified.The first bar displays the total loss.
 - TOTAL LOSS BREAKDOWN BY INVERTER: Displays the total loss of each inverter.

- TOTAL LOSS BREAKDOWN BY LOSS TYPE: Displays the loss of all inverters for each loss type, along with the total loss. The following loss types are plotted:
- To download the data into a PNG or a CSV file, select , and then select the required format.