
Site Overview and Inverters
Access the OVERVIEW Section
The OVERVIEW section contains high-level information of all the blocks, inverters, and combiner boxes in a site, highlighting the ones that need immediate action, thus helping you monitor the health of the site.
Procedure
In the Applications menu, select .
The OVERVIEW section appears, displaying the following information:
- The OVERVIEW graph: Contains a single snapshot view of all the assets being monitored. The innermost level displays the blocks in the site. The next level shows the inverters, and the outermost level shows combiner boxes under the inverters.
If you pause over the inverters in the OVERVIEW section, details of the inverter appear (such as the manufacturer and model of the inverter, today's production, conversion efficiency, availability, AC power, irradiance, open events, and so on).
The status of the assets is indicated in the following colors:- Green: Indicates that the asset is healthy.
- Yellow: Indicates that the asset has warnings.
- Red: Indicates that the asset has critical alarms.
- White: Indicates that the asset is not communicating or that data is not available for the asset for the past 60 minutes.
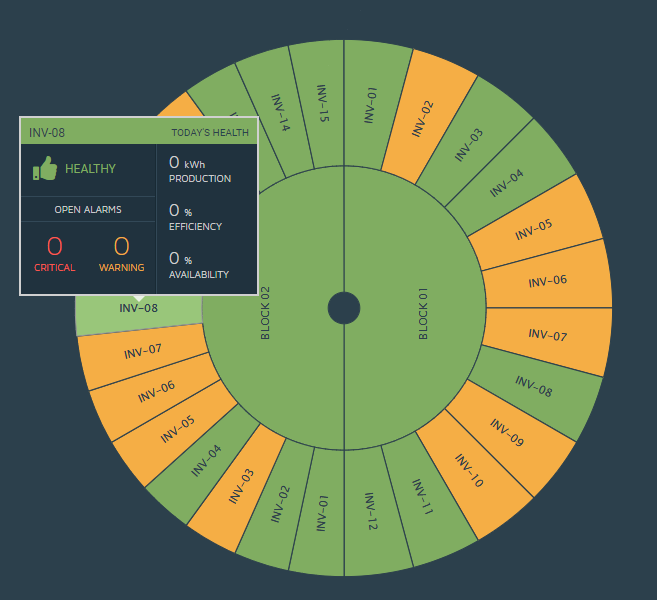
- The INVERTERS section: Contains the total count of inverters for each of the aforementioned statuses. You can filter this section for one or more statuses of the assets in the OVERVIEW graph.
- The Site KPIs section: Contains sections about each of the following key performance indicators (KPIs) for the site:
- PRODUCTION: Displays the instantaneous AC power of the site in MW (indicated in green color) and the irradiance (indicated in yellow color).
- PERFORMANCE RATIO: Displays today's PR, along with the trend chart of the PR values of the last 14 days.
- EVENT SUMMARY: Displays the total number of open alarms, categorized as critical, warning, and informational alarms, along with a pie chart of the same information.
- CAPACITY FACTOR & YIELD: Displays the total CUF and yield value, along with the trend chart of the CUF and yield values of the last 14 days.
- WEATHER: Displays the instantaneous irradiance value and the ambient temperature, along with a trend chart of the irradiance and ambient temperature values of the last 14 days.
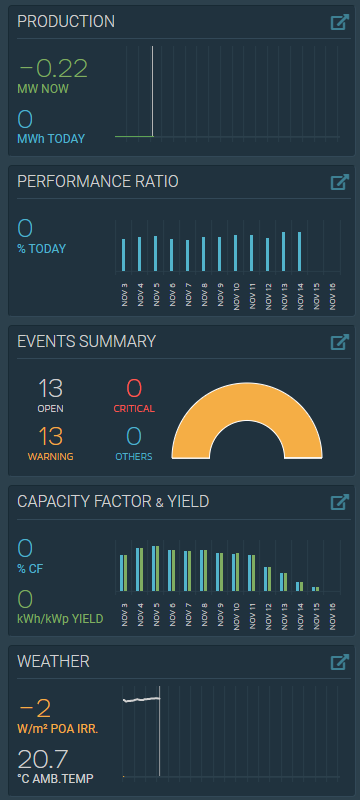
To maximize a section, select .
. - The upper-right section: Contains a link to go to the Fleet Overview page and the last time the site data was processed. By default, the data is refreshed every five minutes, but if the data was not refreshed for the past one hour, the time duration blinks in red color.

Access the INVERTERS Section
The INVERTERS section contains a list of inverters in the site, along with values of their KPIs.
Procedure
- Access the Solar Accelerators home page, and then select Inverters.The INVERTERS section appears, displaying a list of inverters in the site, along with values of their KPIs.
In addition, the total count of inverters in each status (healthy, critical, warning, and no data) appears.
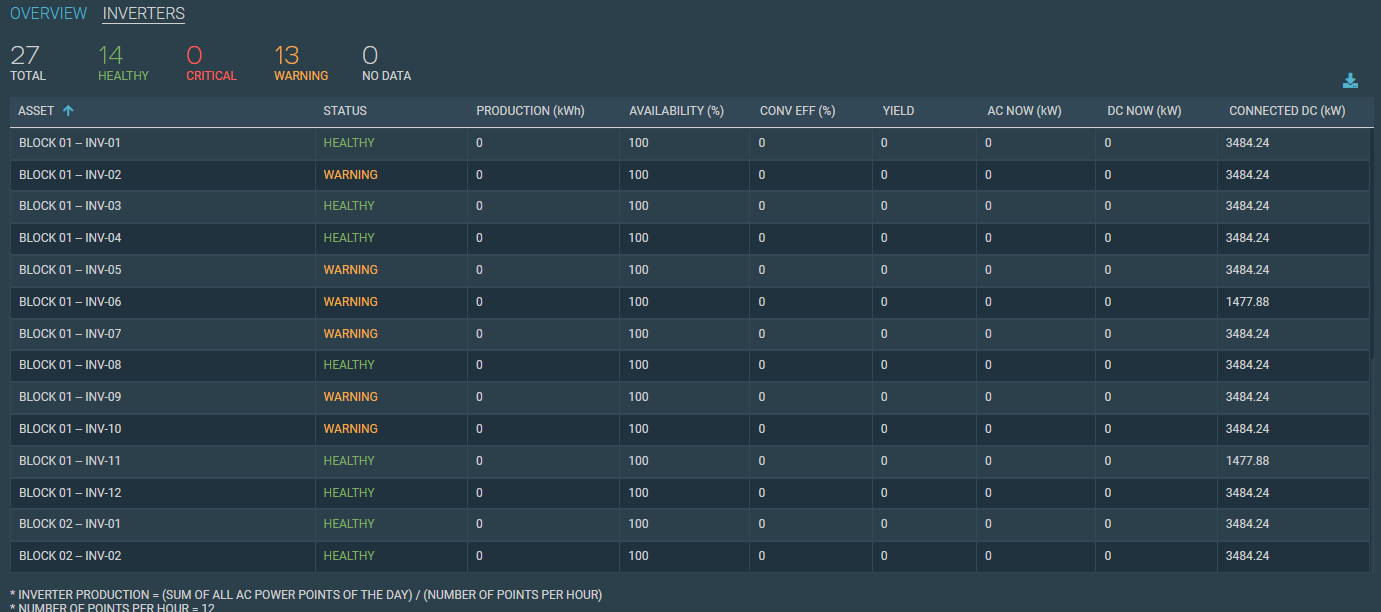
- To download the data into a CSV file, select
 .
.