
Site Events
Access the EVENTS LIST Section
The EVENTS LIST section contains a list of events reported for each asset, along with the opened date, severity, and other information.
Procedure
- In the EVENTS SUMMARY section, select
 .The EVENTS LIST section appears, displaying the current and historical site event data. These events are sorted by asset, event name, and opened date. The COUNT column indicates the number of alarms reported under an asset for a specified opened date.
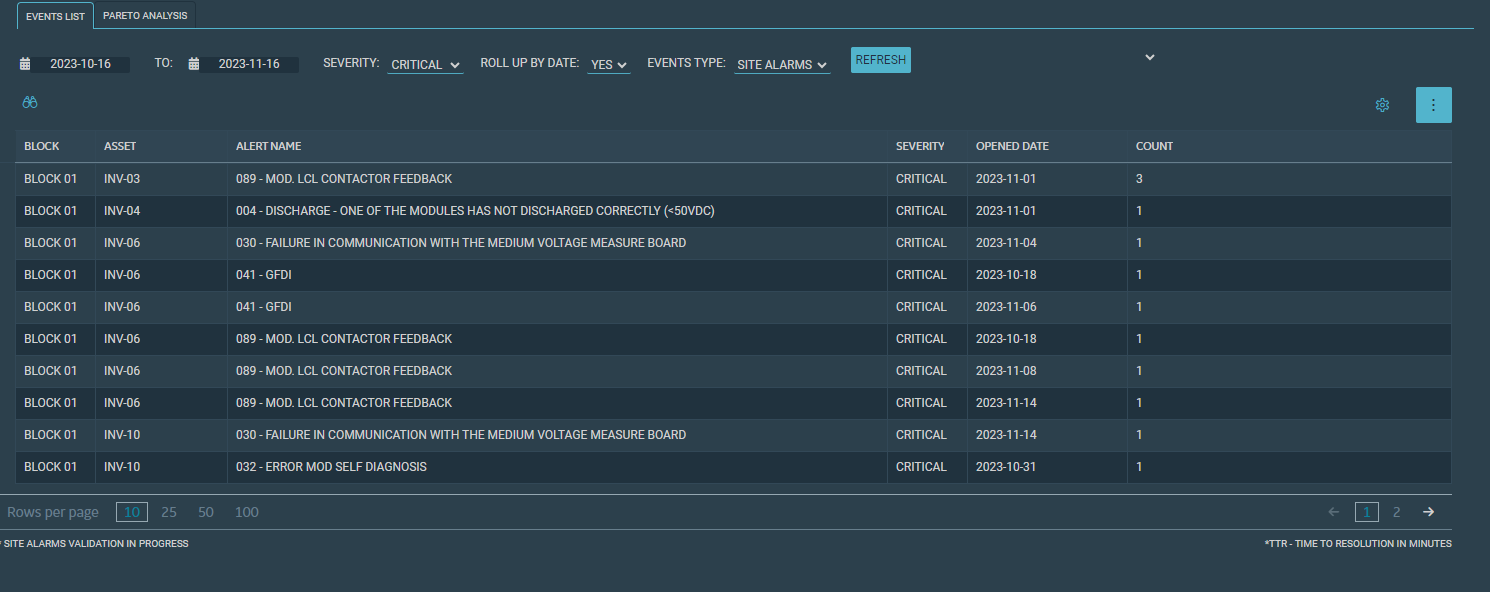
- To download the data into a PNG or a CSV file, select
 , and then select export all data.
 - To add or remove columns, freeze a column to the left, or change the order of the columns, select
 , make the required changes, and then select APPLY.
Access the PARETO ANALYSIS Section
The PARETO ANALYSIS section contains a pareto chart of events reported for each asset. Using this chart, you can analyze the defects, determine major pain points in a site, and identify the events that occur frequently or have long duration (using the mean time between failures (MTBF) or mean time to resolution (MTTR) respectively).
Procedure
- In the EVENTS SUMMARY section, select .The EVENTS LIST section appears.
- To download the data into a PNG or a CSV file, select
 , and then select the required format.