
Getting Started with Analytic Instances
About Analytic Instances
An analytic instance, also known as an analytic deployment, typically represents a piece of equipment, but it can also refer to a system. The instance uniquely identifies, and is the container of, modes and models. Additionally, the analytic instance is an instance of an analytic template of the SmartSignal type, inheriting tags and rules from the template.
Reset Customized Instance Values
If you have a SmartSignal analytic instance locked for editing, you can reset customized values back to the template values. You can reset customized values for all or some of the customized tag values.
Procedure
- Reset customized values for some tags.
- Select
 button to exit the reset to template mode of operation and return to standard editing.Note: Your changes will not be placed into production until you deploy the locked instance. You can cancel your changes by using the Discard Changes action instead of deploying.
The Select Values to Reset to Template action is also available at the model level and the mode of operation is same as listed in this procedure.
- Select
- Reset customized values for all tags.
Access Analytic Instance History
When you access a SmartSignal analytic instance, you can view the history of actions taken regarding the selected instance, and you can also export the analytic instance history to an .xls file.
Procedure
- In the Actions menu, select .
The Analytic Instance History window for the selected instance appears, displaying a table containing details about actions taken regarding the analytic instance during the dates specified in the date boxes. The history for the most recent changes appear by default.
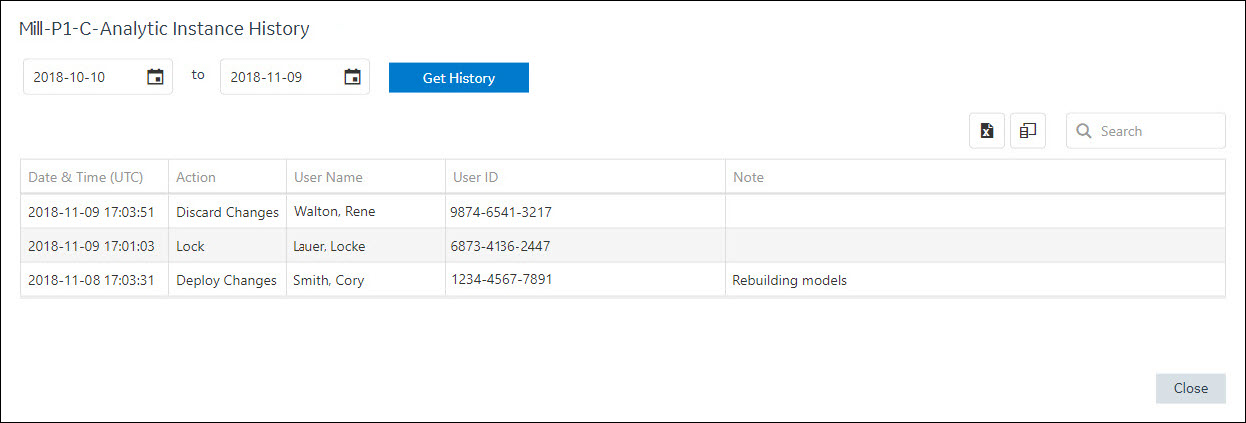
The View Instance History window displays details for a variety of actions that can be taken regarding an analytic instance, including the following actions:
- Deploying or discarding changes
- Synchronizing an instance with a template version
- Activating or inactivating an instance
- Locking an instance for editing
- Importing an instance from a SmartSignal Classic transfer file
- Optional: If you want to specify which columns appear in the window, select
 , and then, in the Column Chooser window, modify the selections as needed.
 - Optional: If you want to export an .xls file containing the data displayed in the Analytic Instance History table, select
 .
.
Copy Analytic Instance
When you access a SmartSignal analytic instance, you can copy it to create another instance. You can use the instance copy to try out different configurations using the same input as the original.
Procedure
Results
Delete an Analytic Instance
When you access a SmartSignal analytic instance that is not locked for editing and you have the permission to modify the instance, you can delete the selected instance.
Procedure
Results
Configure Sensor Health Monitoring for an Analytic Instance
About This Task
Procedure
Configure Sensor Health Monitoring for an Analytic Instance Tag
About This Task
Procedure
- In the table, in the row containing the tag for which you want to configure the Sensor Health Monitoring parameters, in the SHM Configuration column, select
 .The SHM Configuration window appears.
Generate Sensor Health Monitor Timeline Report
In the SmartSignal Maintenance module, you can generate a Sensor Health Monitoring report to view a timeline of Sensor Health Monitoring behavior. This provides insight into the initiating cause of the sensor to go into SHM Alert state, and then shows the length of the Sensor’s SHM Alert.
Procedure
- In the Actions menu, select Health > Sensor Health Report.
If there is no timeline present, this means no sensor has initiated an SHM Advisory event. Adjust the custom date range or choose a present date range from the drop down menu

A timeline report will be generated with the following UI capabilities:
Report Parameter Description Source Tag Default tag view will be Tag Alias. Turn Source Tag to ON to view source tag instead Sort By Allows user to sort by Impacted Tags (default), Tag Alias Alphabetically, or Blueprint Ordinal Position 
Zoom in y axis, showing less sensors 
Zoom out y axis, showing more sensors 
Exports current view as PNG/PDF/JPEG/SVG/GIF File 
Switch to Grid view. Enables capability to filter/sort by Source Tag, Start Date, End Date, Outlier %, Paintbrush %, Faltline %, and NaN %. Also enables export grid view to xlsx. 
Resets to default view
Generate Sensor Health Report
In the SmartSignal Maintenance module, you can generate a report to indicate if the sensors are not working as expected or producing any bad quality data.
Procedure
- In the Actions menu, select Health > Sensor Health Report.
If there are no existing reports, then the Generate Sensor Health Report window appears for you to specify the report parameters.
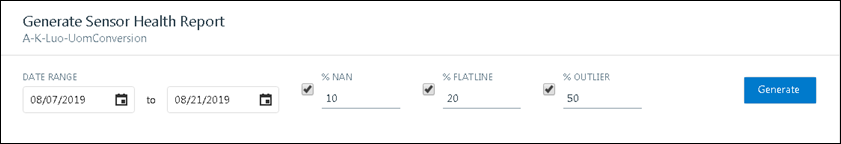
The report will be generated based on the following parameters:
Report Parameter Description DATE RANGE The report uses the tag data that has been processed by the analytic (i.e., observations) over the specified date range. % NAN The percentage tag values that are NAN (i.e., Not A Number) that can be tolerated before it is added to the Watch list. % FLATLINE The percentage tag values that are flat-lined (i.e., is not changing) that can be tolerated before it is added to the Watch list. % OUTLIER The percentage of tag values that are outside actual high/low limits that can be tolerated before it is added to the Watch list. - Select Generate.
The job starts and a progress bar appears that provides the status of the steps performed in the report generation process. The duration of the job depends on the date range specified and the number of tags that are active. After the report is generated, the report is displayed in a table that is divided into three rating sections (i.e., Watch, Warn, Good). You can change the sequence of the rating with the help of the Rating button. You can also expand and collapse each section by selecting the Rating bar.
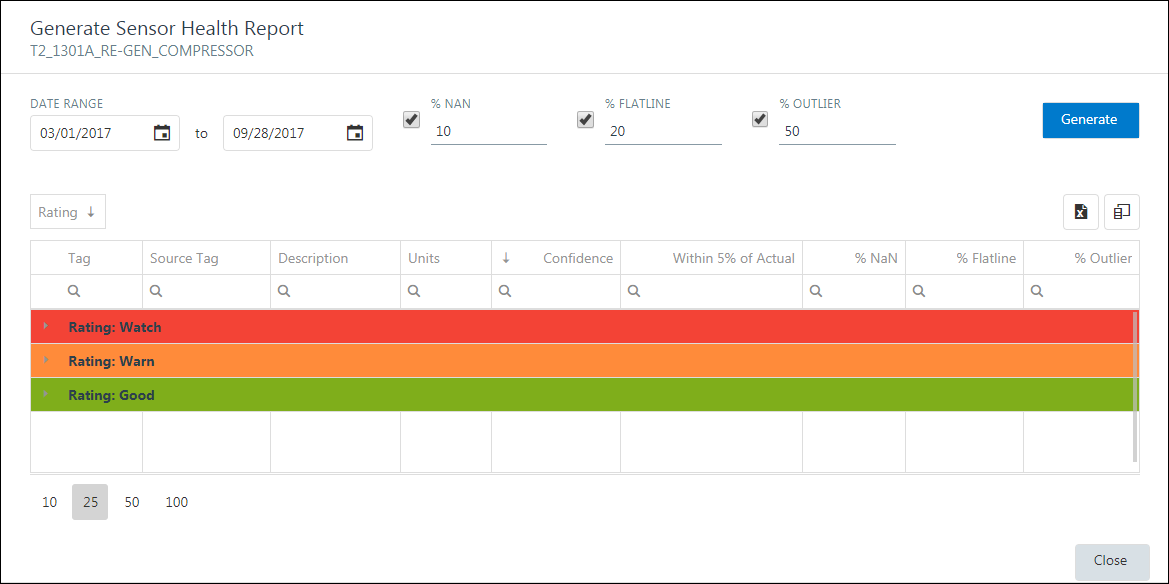
The generated report contains the following columns.
Column Name Description Tag The tag alias name. Source Tag The time series link of the tag. Description The description of the tag. Units The units of measurement for the source data of the tag. Confidence A high percentage indicates confidence in the quality of the tag. A lower percentage indicates that the tag may have quality issues.
The percentage is calculated using a combination of the following:
- The thresholds given for percentage of NaN, Flat-line, and Outlier.
- The tag's estimates are closely matching the sensor values (for the tags that are modeled).
Within 5% of Actual The percentage of tag values, where the estimated value is within 5% of the actual value. % NaN The percentage tag values that are NaN (i.e., Not A Number). % Flatline The percentage tag values that are flat-lined (i.e., is not changing). % Outlier The percentage of tag values that are outside actual high/low limits. - Select to export an .xls file containing the data displayed in the report.
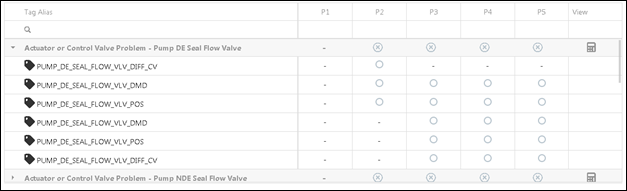
Generate Diagnostic Coverage Report
In the SmartSignal Maintenance module, you can generate a report that indicates how well the diagnostic rules defined in the template are being covered by this instance.
Procedure
- In the Actions menu, select .
The Diagnostic Coverage Report window appears for you to specify the report parameters.

The report will be generated based on the following parameters:
Report Parameter Description Ignore inactive models By default, the report will not include inactive models when determining rule coverage by excluding the inactive models in report. You can clear this check box to see the coverage using all models defined in the template. Note: If the analytic instance is locked for editing, the report will be generated based on the configuration details of the locked instance.
Tip: If you want to generate the report based on the configuration details of the deployed instance, select the Show Deployed Report check box.
- Select Generate.
The job starts and a progress bar appears that provides the status of the steps performed in the report generation process. After the report is generated, the report is displayed in a table that is divided into three sections (i.e., Fully Covered, Partially Covered, Not Covered). You can use the check box above each section to filter the diagnostic rules that appear in the grid below. You can also expand and collapse each diagnostic rule to see the underlying contributing tags.

The generated report contains the following columns.
Column Name Description Diagnostic Rule Name The name of the diagnostic rule as defined in the corresponding analytic template. Tag Alias The tag alias name. P1 – P5 Visual indication of each priority level configured in the rule and whether it is covered by the tag and model configuration. View Press the calculator icon to see the full diagnostic rule expression. - Select the row to expand the grid to see the tags that contribute to diagnostic rule.Each tag has a corresponding icon that signifies the priorities of the tag contributes and whether the tag is active for that priority.
- Select to export an .xls file containing the data displayed in the report.
Clean Training Data
You can clean the training data to reduce its disk space usage and to improve the performance of the SmartSignal Maintenance module.
Procedure
Results
Modify Settings for an Analytic Instance
In the SmartSignal Maintenance module, you can modify the settings associated with an analytic instance, including the instance name, description, and data collection settings.
Procedure
Export SmartSignal Analytic Data
You can export a SmartSignal analytic from APM to a file format that is compatible for importing back to your SmartSignal Classic product.
Procedure
Output Tag Health
View Output Tag Health
Output tags use formulaic calculations to create records. In the SmartSignal Maintenance module, you can view the health of output tags used to create records.
Procedure
- In the Actions menu, select .The Output Tag Health window appears, displaying a list of active output tags used in the selected Deployment. The image below shows the Output Tag Health window with a tag selected.

One of the following icons appears next to each output tag to indicate the status of the tag:Icon Description 
Indicates that the formula contains a sufficient number of active input tags for the calculation to be able to evaluate and produce reliable data. 
Indicates that the formula does not contain a sufficient number of active input tags for the calculation to be able to evaluate and produce reliable data. 
Indicates an inability to determine whether the formula contains enough active input tags for the formula to be able to evaluate and produce reliable data. If you see this icon, you should manually review the formula and the input tags it uses.
Inactivate Output Tags
About This Task
Depending on the status and quantity of input tags used in the formula for an output tag, you may want to deactivate the output tag. For example, if an output tag formula includes inactive input tags, the calculation may not work and may result in inaccurate model data. Complete the following steps to identify and inactivate output tags that you do not want to use.
Procedure
Access Constants for a SmartSignal Deployment
In the SmartSignal Maintenance module, you can access the constants associated with a deployment.
Procedure
Validate with Asset Tags
In the SmartSignal Maintenance module, you can validate that the Asset Tags that have been associated with the analytic instance are without issue.
Procedure
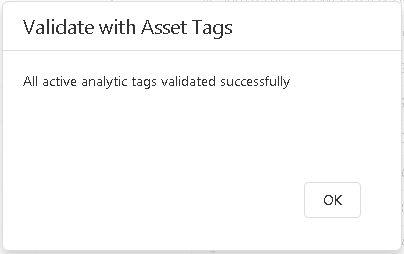
- In the Actions box, select Health > Validate with Asset Tags.If there are no issues found with the current tag configuration, the Validate with Asset Tags window appears.
If one or more of the following conditions are identified:
- A time series link in analytic data source is different from the link defined in the associated APM Asset tag.
- A tag alias was not found in the input or output mapping of the analytic.
- A tag alias was not found in the associated APM Asset tag list.
- The UOM defined in the SmartSignal Analytic Instance was not compatible with the UOM defined in the associated APM Asset tag.
- The UOM defined in the APM Asset tag is not support by the SmartSignal Analytic engine.
The Validate with Asset Tags – Issues Found window appears.
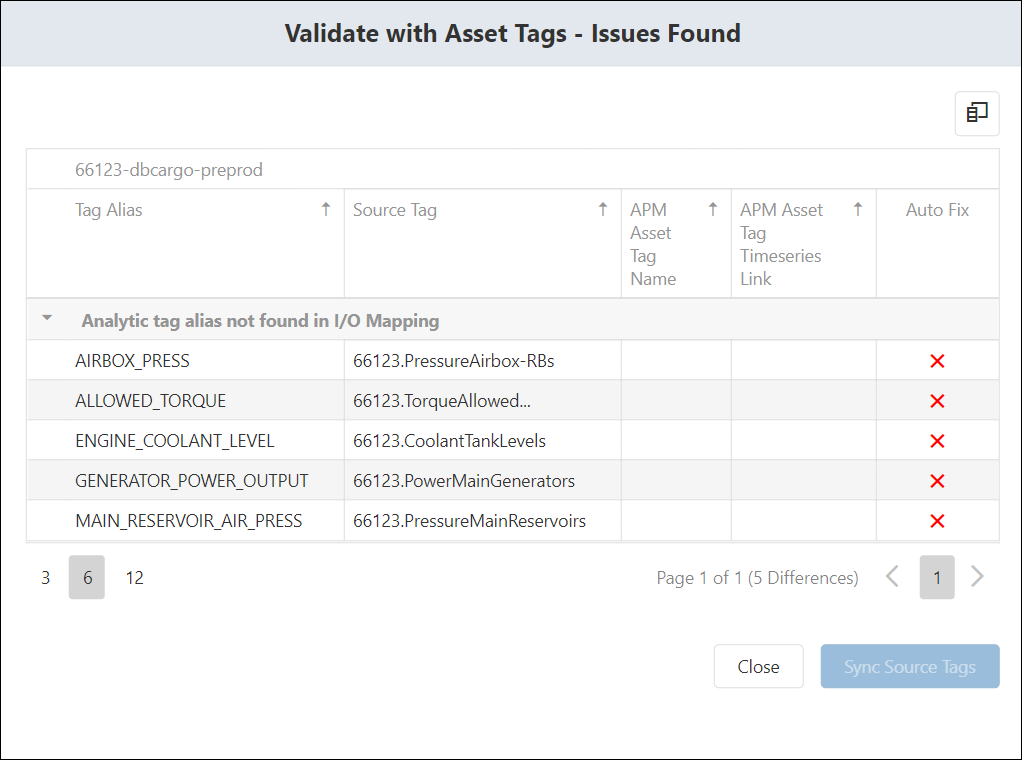
The table displayed in the image are described in the following table.
Column Name Description Tag Alias Analytic instance tag alias. This name is defined in the analytic template. Source Tag Analytic instance source tag name. Standard Units Analytic instance standard units. Standard Units Category Analytic instance Unit of Measure category APM Asset Tag Name APM Asset Tag’s name in the I/O map APM Asset Tag Timeseries Link APM Asset Tag’s Timeseries link APM Asset Tag UOM APM Asset Tag’s Unit of Measure APM Asset Tag UOM Category APM Asset’s Tag Unit of Measure category Auto Fix True: The issue will be fixed when instance is deployed. False: The issue cannot be fixed automatically. User action required.