
Trend Run-Time Configuration
Once the chart is live, the runtime customization settings allows for more flexibility and user control when viewing real-time or historical data.
At runtime, select  on the
chart's toolbar to access the custom settings as shown in the following figure.
on the
chart's toolbar to access the custom settings as shown in the following figure.

| Field Name | Description |
|---|---|
| Mode | This setting allows you to choose whether you want to view real-time data
(Live) or past data (Historical) in the trend chart.
Note: Changes made to 'Live' affect 'Historical' as
well. For example, if you add/delete properties from the chart in the Live
mode, these changes reflect when you shift to the Historical mode as
well. |
| Duration | This setting allows you to select the time range of the data you want to
view in the chart. You can use the pre-defined intervals (e.g., 1 Minute, 5
Minutes, 1 Hour, etc.) for quick selections. If none of the pre-defined options
fit, you can enter your own specific time range by filling out the
Custom fields. Select a duration for which you want
to plot the data. The selected duration is subtracted from the
End time to deliver past trends. You can go back
in time in minutes, hours, days, or provide a customized duration.
|
| End | Allows to set an end date and time for trending historical data.
Select
|
| Now | Allows to update the End time to your current
system time. The toggle is enabled by default when you enter the
Historical mode for the first time. Choosing a
different date and time automatically disables the toggle.
|
| Sampling Increment | Select whether you want to increment the sampling data based on time or
count, and then specify the time or count, respectively.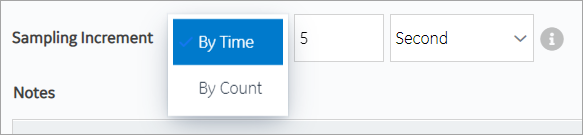 Note: The sampling increment may not always be
honored. The maximum number of data points plotted on the trend chart is
3000 when sampling by time, and 8000 when sampling by count. You can zoom in
to view more accurate data. |
| Display | You have the option to set a display style on how tags appear across the
trend card. The selected display style applies to configured source tags (except third
party OPC UA and asset model tags), chart tooltip/legend, and Historian statistical data. Choose from these options:
|
| Notes | You can add notes only to historical trends, and not for OPC UA based
trends. Switch the toggle to enable viewing or adding a note on the trend chart. On the trend chart:
When you access an existing note, the timestamp and tag values that appear during the initial loading of the note correspond to the x-axis and y-axis values for the data point, respectively. If you select each individual note, the actual raw and timestamp values to which the comment was added in the Historian archive appear. If you add a note to an interpolated value, it is added to the nearest raw value. Due to this, the value displayed in the note may not always match the value plotted on the chart. |
| Query Criteria | Applies to Historical mode, and for Historian data sources only. This
option allows you to query tag data based on timestamps. Note: Trend via Tag Query can be performed on the tags of
the same Historian server only, and not from multiple Historian
sources. If you want to change to a different Historian data source to
query tags, do the following:
For example, consider you have two tags in your system
- Tag1, Tag2. You can configure a query criteria wherein you request to plot
the Tag1 data for last one hour that matches with the conditions applied to
the Tag2 data.
To modify or update any added query conditions, select the
pencil icon.  |
| Sources | Data can be plotted to the trend chart using properties from an asset
model. In the absence of an asset model, you can also directly browse the data
source address space and select tags for the trend chart. Select Add Tags for Trend to select the properties or tags that you want to add to the trend chart.  Tags marked as Note: Nodes only work for plotting historical data. They do
not work in Live mode. |
| SAMPLING MODE | For each tag SOURCE, you can add multiple sampling
modes. This option is available only for the historical mode. Select [Add Sampling Mode] to add additional sampling modes for a tag. For example, you can have 3 different sampling modes for a single tag in the trend chart. Highlight each mode with a different line color, style, and thickness. 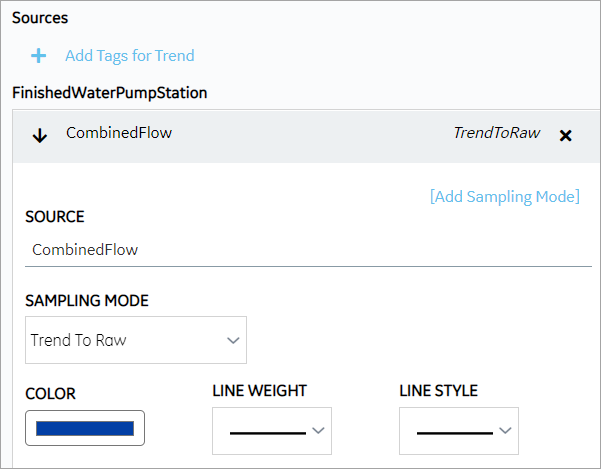 These are the modes available to plot data:
You can trend each tag-sampling mode combination only once. For example, if Trend To Raw mode is applied to Water Temp tag, this mode becomes inactive for this tag. The other modes are available to use. To delete a plotted sampling mode, select For more information on the sampling modes, refer to the Historian documentation. |
| Specification Limits | To monitor a process performance, you can define upper, lower, or
targeted limits (from varied data sources) and plot these lines on the trend
chart. Provide specification limits for UPPER
LIMIT, TARGET, LOWER
LIMIT as follows:
To highlight each plotted line with a unique line color, thickness, and/or style, choose a COLOR, LINE WEIGHT, and LINE STYLE.  To remove a plotted limit from the chart, select
|
| Chart Y Axis Configuration | Allows to compare two or more tags/sources by having a common Y-axis on the trend chart. This option is disabled if you selected the Stacked Y-axis mode. |
 .
. .
.  .
.
 are from the Historian data source. Tags marked as
  are from the real time
data sources such as iFIX, CIMPLICITY, and any other OPC UA server.
are from the real time
data sources such as iFIX, CIMPLICITY, and any other OPC UA server. next to the
tag.
next to the
tag. next to the
specification limit. You can set the specification limits for both live and
historical mode, and save the chart to favorites.
next to the
specification limit. You can set the specification limits for both live and
historical mode, and save the chart to favorites.