Let’s say you’re a developing country whose power grid is saddled with inefficient oil-fired power generation and you need to electrify quickly to meet the needs of a fast-growing economy. You might build out your solar, wind, battery storage, natural gas, or all of the above — but who can you call for help and advice?
Related News
GE Vernova and PROTEC celebrate graduation of Next Engineers: Engineering Academy class
-
43 learners graduate from programme designed to inspire the next generation of engineers
JOHANNESBURG, South Africa (October 10, 2025) – Next Engineers, a global college- and career-readiness programme working to increase the opportunities for young people in engineering, celebrated the graduation of 43 learners from the Engineering Academy in Johannesburg, South Africa. The graduation ceremony, held at The University of the Witwatersrand, Johannesburg, marked the programme’s second graduating class and highlights its contribution towards bridging the science, technology, engineering and mathematics (STEM) skills gap in the country through exposing learners to hands-on engineering experiences and career pathways.
The 43 learners, representing 15 high schools across Johannesburg, were joined by their families to celebrate their achievements. Many of these learners plan to pursue engineering-related qualification at universities and technical institutions. Launched in 2022, PROTEC, University of Witwatersrand, and Kutitiva Foundation are the educational partners for the local Next Engineers programme. GE Vernova engineers and employees play an active role by engaging with Engineering Academy participants through hands-on, skill-based volunteering. In the 2024 calendar year, its Johannesburg-based employees donated over 680 hours to these efforts.
“We are delighted to celebrate the achievements of this year’s graduates and commend their dedication to pursuing careers in engineering,” said Matsi Eseu, South Africa HR Director for GE Vernova. “Supporting young talent through programmes like Next Engineers is central to GE Vernova’s mission. In Johannesburg, we see first-hand how these opportunities empower students to unlock their potential and contribute to solving real-world challenges. We are honored to play a role in shaping a more dynamic future for engineering in South Africa.”
Learners who complete the Engineering Academy program and enroll in a qualified engineering or engineering-related degree programme receive financial aid to support them as they continue on their paths to becoming engineers. To date, the Next Engineers programme in Johannesburg has reached nearly 4,100 learners and awarded $36,000 in scholarships to qualifying graduates. In addition, locally, GE Vernova awarded an additional $83,000 in scholarships to ten graduates through the country’s External Bursary Programme.
Dr. Nomalungelo Gina, Deputy Minister of Science, Technology, and Innovation, said: “I applaud PROTEC for its role in promoting STEM education and helping to develop a cohort of young people who represent the core of our future workforce. You have chosen to be the bridge between potential and opportunity for many young people in our country. You reach places that, for a variety of reasons, government programmes may not always reach - our rural communities, under-resourced schools, and marginalized groups. Your programmes continue to ignite curiosity, nurture the raw talent and open doors for young people who would otherwise be left behind. Your mentorships, youth clubs, bootcamps, and your efforts to bring scientific experiments and floating laboratories to those who have never seen a science laboratory in their lives is a transformative experience. You have helped a young girl in a village believe she can be an engineer and shown a boy from the township that coding is not only for those in affluent urban centres; careers in engineering are meant for them as well. Let us therefore commit, collectively, to building the science, technology, and engineering foundations that will carry our continent into a future we will co-create. As government, we are your ally; we do not see you as gap-fillers, but as catalysts for transformation.”
“We’re proud to celebrate the accomplishments of this year’s Engineering Academy graduates. Their drive and curiosity exemplify the promise of South Africa’s next generation of engineers,” said Balan Moodley, CEO of PROTEC. “We are grateful to GE Vernova for their vision and commitment in making this program possible. Together, we have helped deliver opportunities that have contributed to empowering young minds."
STEM training and education, such as Next Engineers, is helping to solve global challenges while also lifting up communities through economic opportunities. GE Vernova’s commitment to nurturing future STEM talent in South Africa extends beyond Next Engineers: through its External Bursary Programme, the company has provided comprehensive bursaries totaling $7.3 million (R128.5 million) to more than 900 beneficiaries pursuing Bachelor’s degrees in Science, Commerce, and Arts since 2020 to date. These bursaries help alleviate the financial burden for tertiary students, covering tuition, accommodation, textbooks, and monthly stipends for the duration of their studies.
For more information about Next Engineers and the Engineering Academy, visit NextEngineers.org.
###
About Next Engineers
Next Engineers, a program originally funded by the GE Foundation in 2021, now known as the GE Aerospace Foundation, is a college- and career-readiness program dedicated to inspiring and preparing the next generation of engineers. Through innovative programs, mentorship, and community partnerships, we empower young minds to shape a better future through engineering.
About GE Vernova
GE Vernova Inc. (NYSE: GEV) is a purpose-built global energy company that includes Power, Wind, and Electrification segments and is supported by its accelerator businesses. Building on over 130 years of experience tackling the world’s challenges, GE Vernova is uniquely positioned to help lead the energy transition by continuing to electrify the world while simultaneously working to decarbonize it. GE Vernova helps customers power economies and deliver electricity that is vital to health, safety, security, and improved quality of life. GE Vernova is headquartered in Cambridge, Massachusetts, U.S., with approximately 75,000 employees across approximately 100 countries around the world. Supported by the Company’s purpose, The Energy to Change the World, GE Vernova technology helps deliver a more affordable, reliable, sustainable, and secure energy future. Learn more: GE Vernova, GE Vernova in Middle East & Africa, and LinkedIn.
The GE Vernova Foundation supports the Next Engineers in Johannesburg, South Africa under an arrangement with the GE Aerospace Foundation.
About PROTEC
PROTEC was established in 1982 by a group of engineers from the South African Institute of Civil Engineers to respond to the challenges facing the education system and to address representation across all socio-economic and racial groups in STEM careers. To date, PROTEC has seen more than 40,000 learners complete the Learner Excellence Programme. Based in Randburg, PROTEC has 17 branches and projects in 6 out of the 9 provinces. Our aim is to extend the programme to all 9 provinces. The programme targets learners from Grade 4 to Grade 12 in specifically Science, Mathematics, and English. Teachers who teach these subjects as well as coding and robotics, benefit from development and support that uses a centre-based and classroom support model. Find us on www.protec.org.za, Facebook, LinkedIn and Instagram.
end
© 2025 GE Vernova and/or its affiliates. All rights reserved.
GE and the GE Monogram are trademarks of General Electric Company used under trademark license.
Press Resources

Media inquiries
Annette Reed
Programme for Technological Careers (PROTEC) | Fundraising and Business DevelopmentEye on the Summit: MIT Grad Matias Opazo Climbs Higher with GE Vernova
Related News
GE Vernova Hitachi Nuclear Energy and Samsung C&T form strategic alliance to advance deployment of the BWRX-300 small modular reactor
WILMINGTON, North Carolina (October 7, 2025) – GE Vernova Hitachi Nuclear Energy (GVH) and Samsung C&T, a leading construction and engineering company, have announced a strategic alliance to advance the deployment of the BWRX-300 small modular reactor (SMR) in strategic global markets, outside North America. The two companies will focus their collective efforts on developing the supply chain and project delivery solutions for GVH’s SMR. Further, they will work together in the potential deployment of five BWRX-300s in Sweden.
“With the first unit of our BWRX-300 under construction in Canada, we are well positioned to lead the deployment and scale of the SMR industry,” said Maví Zingoni, CEO Power, GE Vernova. “This collaboration with a leading player like Samsung C&T, which has a solid track-record of helping to deliver nuclear projects safely, on-time and on-budget, will further strengthen the BWRX-300 position among the most advanced, deployment ready, and lowest risk SMR technology available today.”
“This agreement marks a strategic collaboration where Samsung C&T and GVH aim to become global leaders in the nuclear power segment. The collaboration will capitalize on Samsung C&T's extensive experience in nuclear power and infrastructure project execution, combined with GVH's validated technological expertise,” added Se-chul Oh, Samsung C&T CEO.
The first BWRX-300 is under construction at Ontario Power Generation’s Darlington site in Canada, with completion expected by the end of the decade, which will make it the first small modular reactor in the Western World. Key components like the reactor pressure vessel are being manufactured, and site construction is progressing according to plan.
Additionally, the U.S. Nuclear Regulatory Commission has accepted and is reviewing Tennessee Valley Authority’s (TVA) application to construct the first BWRX-300 in the U.S., at the utility’s Clinch River site in Oak Ridge, Tennessee; and Orlen Synthos Green Energy (OSGE) has selected Włocławek as the site for Poland’s first SMR. In Sweden, Vattenfall has down-selected the BWRX-300 as it evaluates the construction of new reactors adjacent to its Ringhals plant site on the Värö Peninsula.
Each BWRX-300 can provide approximately 300 MW of electricity, enough to produce the equivalent electricity needed to power 300,000 homes while significantly reducing the complexity and cost associated with traditional nuclear reactors.
Samsung C&T’s Engineering & Construction Group has more than 40 years of engineering and construction experience operating throughout the world. The group spans commercial and residential buildings, civil infrastructure and plant construction. Its landmark projects include Burj Khalifa - the world’s tallest building, the ongoing Riyadh Metro Project in Saudi Arabia, the Qurayyah 4,000MW CCPP Project, and the ongoing Qatar 2,000MW Solar Power Project. In the nuclear energy sector, the company has successfully delivered 12GW across 10 units, including the 5.6GW Barakah Nuclear Power Plant in the UAE. It has recently undertaken the Nuclear Power Plant refurbishment project and Front-End Engineering Design (FEED) for Small Modular Reactors (SMRs), demonstrating its global competitiveness in large-scale reactor and SMR technologies, and solidifying its expertise across all areas of the nuclear industry.
###
Notes to editors - image captions
Image 1
Maví Zingoni, CEO Power, GE Vernova, and Se-chul Oh, Samsung C&T CEO.
Image 2
(left to right) Jason Cooper, CEO Advanced Nuclear, GVH; Se-chul Oh, Samsung C&T CEO; Maví Zingoni, CEO Power, GE Vernova; Jung E. Kim, SVP, Nuclear Sales & Business Development, Samsung C&T.
end
About GE Vernova
GE Vernova Inc. (NYSE: GEV) is a purpose-built global energy company that includes Power, Electrification and Wind segments and is supported by its accelerator businesses. Building on over 130 years of experience tackling the world’s challenges, GE Vernova is uniquely positioned to help lead the energy transition by continuing to electrify the world while simultaneously working to decarbonize it. GE Vernova helps customers power economies and deliver electricity that is vital to health, safety, security, and improved quality of life. GE Vernova is headquartered in Cambridge, Massachusetts, U.S., with approximately 85,000 employees across approximately 100 countries around the world. Supported by the Company’s purpose, The Energy to Change the World, GE Vernova technology helps deliver a more affordable, reliable, sustainable, and secure energy future.
About GE Vernova Hitachi Nuclear Energy
GE Vernova’s Nuclear energy business, through its global alliance with Hitachi, is a world-leading provider of nuclear fuel bundles, services, and advanced nuclear reactor designs. Technologies include boiling water reactors and small modular reactors, such as the BWRX-300, which is one of the simplest, yet most innovative boiling water reactor designs. GE Vernova’s Nuclear fuel business, Global Nuclear Fuel (GNF), is a world-leading supplier of boiling water reactor fuel and fuel-related engineering services. GNF is a GE Vernova-led joint venture with Hitachi, Ltd. and operates primarily through Global Nuclear Fuel-Americas, LLC in Wilmington, N.C., and Global Nuclear Fuel-Japan Co., Ltd. in Kurihama, Japan. HITACHI is a trademark of Hitachi, Ltd. used under trademark license. GE is a trademark of General Electric Company used under trademark license.
Forward-Looking Statements
This document contains forward-looking statements – that is, statements related to future events that by their nature address matters that are, to different degrees, uncertain. These forward-looking statements often address GE Vernova’s expected future business and financial performance and financial condition, and the expected performance of its products, the impact of its services and the results they may generate or produce, and often contain words such as “expect,” “anticipate,” “intend,” “plan,” “believe,” “seek,” “see,” “will,” “would,” “estimate,” “forecast,” “target,” “preliminary,” or “range.” Forward-looking statements by their nature address matters that are, to different degrees, uncertain, such as statements about planned and potential transactions, investments or projects and their expected results and the impacts of macroeconomic and market conditions and volatility on the Company’s business operations, financial results and financial position and on the global supply chain and world economy.
© 2025 GE Vernova and/or its affiliates. All rights reserved.
GE and the GE Monogram are trademarks of General Electric Company used under trademark license.
Press Resources

Signing ceremony (names at bottom of release)

Signing ceremony (names at bottom of release)
Product Information
Investor inquiries
Michael Lapides
GE Vernova | Vice President of Investor Relations
Media inquiries
GE Vernova to announce third quarter 2025 financial results on October 22
CAMBRIDGE, Mass. (October 6, 2025) – GE Vernova Inc. (NYSE: GEV) is scheduled to release its third quarter 2025 financial results on Wednesday, October 22, 2025, before market open. GE Vernova CEO Scott Strazik and CFO Ken Parks will discuss the company’s financial results in a webcast at 7:30 AM ET, which can be accessed at https://www.gevernova.com/investors/events/ge-vernova-3rd-quarter-2025-earnings-webcast.
The earnings press release and supplementary financial information, including reconciliations of non-GAAP financial measures, will also be posted at the same link on the GE Vernova Investor Relations website. A replay of the call will be made available as a direct download on GE Vernova’s website at www.gevernova.com/investors/events.
Additional Information
GE Vernova’s website at www.gevernova.com/investors contains a significant amount of information about GE Vernova, including financial and other information for investors. GE Vernova encourages investors to visit this website from time to time, as information is updated, and new information is posted. Investors are also encouraged to visit GE Vernova’s LinkedIn and other social media accounts, which are platforms on which the company posts information from time to time.
end
About GE Vernova
GE Vernova Inc. (NYSE: GEV) is a purpose-built global energy company that includes Power, Electrification and Wind segments and is supported by its accelerator businesses. Building on over 130 years of experience tackling the world’s challenges, GE Vernova is uniquely positioned to help lead the energy transition by continuing to electrify the world while simultaneously working to decarbonize it. GE Vernova helps customers power economies and deliver electricity that is vital to health, safety, security, and improved quality of life. GE Vernova is headquartered in Cambridge, Massachusetts, U.S., with approximately 85,000 employees across approximately 100 countries around the world. Supported by the Company’s purpose, The Energy to Change the World, GE Vernova technology helps deliver a more affordable, reliable, sustainable, and secure energy future.
© 2025 GE Vernova and/or its affiliates. All rights reserved.
GE and the GE Monogram are trademarks of General Electric Company used under trademark license.
Press Resources

Investor inquiries
Michael Lapides
GE Vernova | Vice President of Investor Relations
Media inquiries
Adam Tucker
GE Vernova | Director of Financial CommunicationsGlobal Nuclear Fuel introduces next generation fuel product
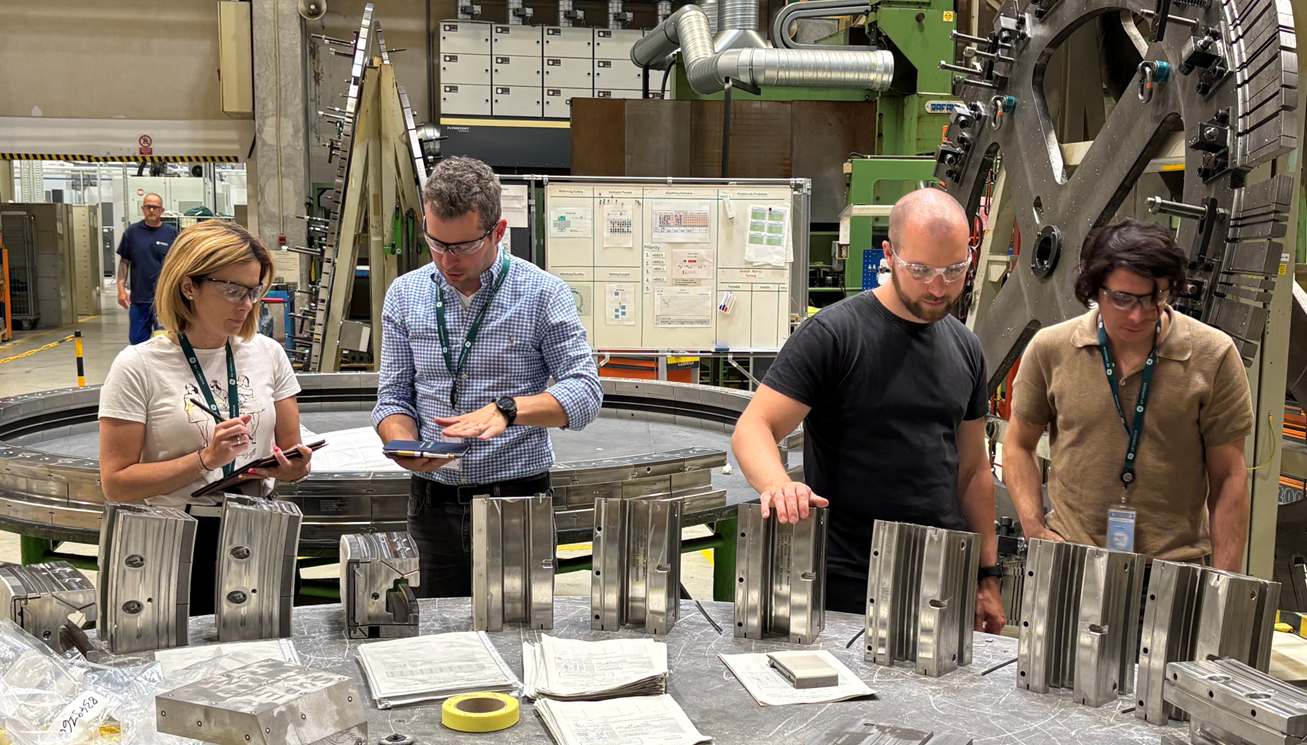
WILMINGTON, North Carolina (October 6, 2025) – Global Nuclear Fuel (GNF, a GE Vernova-led alliance with Hitachi, Ltd.) today announced the introduction of GNF4, a next generation nuclear fuel product built on a 60-year legacy of boiling water reactor (BWR) fuel design innovation and performance.
The 11x11 GNF4 product builds upon the operating history of GNF2 and GNF3 and features two advanced components that are licensed by the U.S. Nuclear Regulatory Commission: Ziron cladding and aluminosilicate doped uranium dioxide pellets.
Ziron cladding was developed to better resist corrosion, ensuring that fuel remains safe and reliable and is an enhancement to the Zircaloy 2 cladding that has been utilized in more than 175,000 GNF fuel assemblies worldwide. Aluminosilicate doped uranium dioxide pellets add an extra layer of reliability. GNF4 will also utilize GNF’s proprietary NSF channel material and Defender+ debris filter.
“GNF4 is engineered to provide plant operators with lower fuel costs per megawatt hour through increased performance and reliability,” said Craig Ranson, Installed Base CEO, GE Vernova Hitachi Nuclear Energy. “Our engineering and supply chain teams are leveraging their BWR expertise to introduce this next generation fuel.”
GNF4 is being fabricated at GNF’s manufacturing facility in Wilmington, NC. The first lead use assemblies of GNF4 are contracted for deployment in 2026 and full reload quantities are expected to be available in 2030.
GNF provides a wide range of services to support nuclear power plants including expert core and fuel cycle engineering, reload licensing and core management services, predictive reports and fuel reliability risk assessments, cyber-secure core monitoring and fleet analytics, fuel examination services and consulting on reactor operations and long-term fuel storage.
end
About GE Vernova
GE Vernova Inc. (NYSE: GEV) is a purpose-built global energy company that includes Power, Electrification and Wind segments and is supported by its accelerator businesses. Building on over 130 years of experience tackling the world’s challenges, GE Vernova is uniquely positioned to help lead the energy transition by continuing to electrify the world while simultaneously working to decarbonize it. GE Vernova helps customers power economies and deliver electricity that is vital to health, safety, security, and improved quality of life. GE Vernova is headquartered in Cambridge, Massachusetts, U.S., with approximately 85,000 employees across approximately 100 countries around the world. Supported by the Company’s purpose, The Energy to Change the World, GE Vernova technology helps deliver a more affordable, reliable, sustainable, and secure energy future.
About GE Vernova Hitachi Nuclear Energy
GE Vernova’s Nuclear energy business, through its global alliance with Hitachi, is a world-leading provider of nuclear fuel bundles, services, and advanced nuclear reactor designs. Technologies include boiling water reactors and small modular reactors, such as the BWRX-300, which is one of the simplest, yet most innovative boiling water reactor designs. GE Vernova’s Nuclear fuel business, Global Nuclear Fuel (GNF), is a world-leading supplier of boiling water reactor fuel and fuel-related engineering services. GNF is a GE Vernova-led joint venture with Hitachi, Ltd. and operates primarily through Global Nuclear Fuel-Americas, LLC in Wilmington, N.C., and Global Nuclear Fuel-Japan Co., Ltd. in Kurihama, Japan. HITACHI is a trademark of Hitachi, Ltd. used under trademark license. GE is a trademark of General Electric Company used under trademark license.
© 2025 GE Vernova and/or its affiliates. All rights reserved.
GE and the GE Monogram are trademarks of General Electric Company used under trademark license.
Press Resources

GNF4 is being fabricated at GNF's manufacturing facility in Wilmington, NC.
Image credit: GE Vernova Hitachi
Product Information
Media inquiries
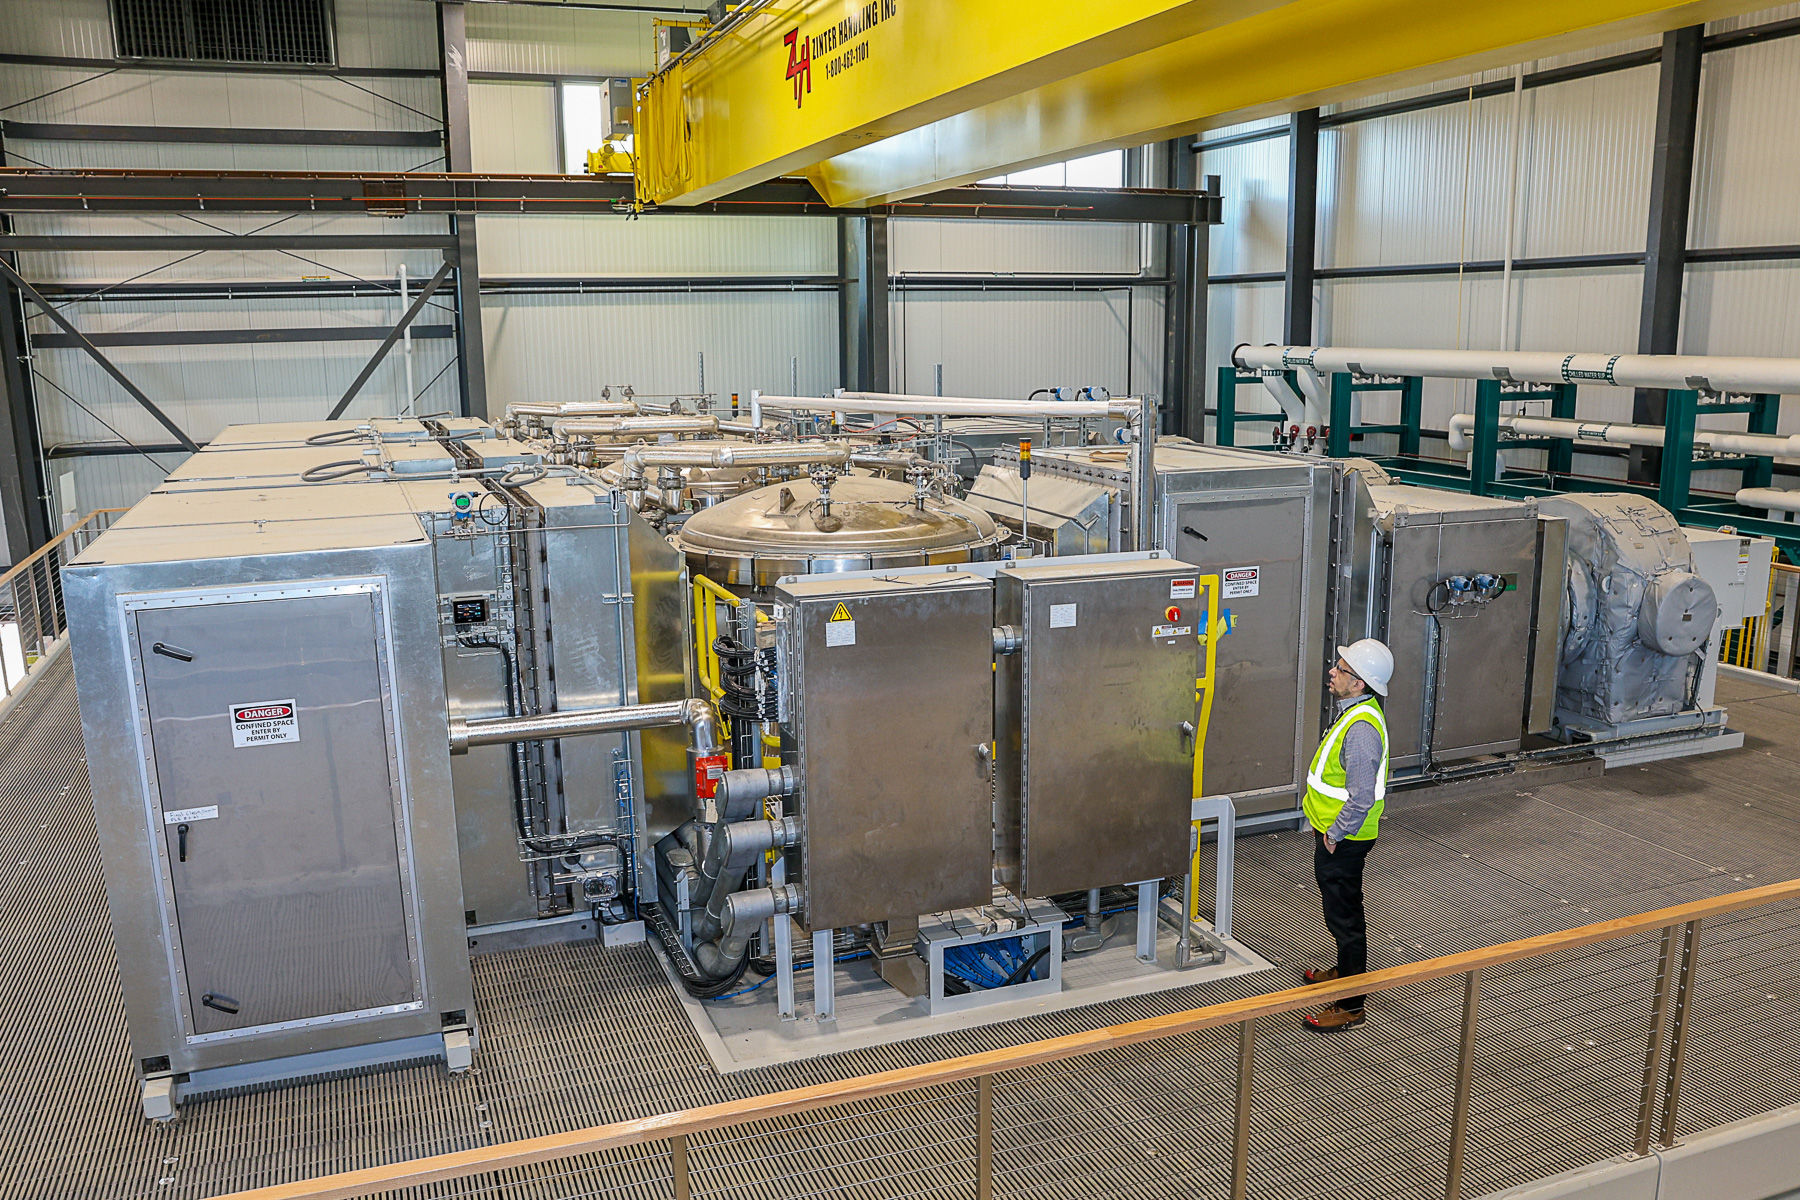
Emission Impossible: How GE Vernova Is Writing the Blueprint for Capturing CO2 Directly from the Air
Every industry is aspiring to minimize their CO₂ emissions and achieve net zero. But in some industries, reducing CO₂ emissions is not as straightforward as in others, due to constraints such as mobility, footprint, or inherent process steps that make it hard to decarbonize these sectors. That’s where an innovative solution and a scalable technology called direct air capture (DAC) comes in.
Related News
Front Row at Climate Week: Accelerating the Future of Energy
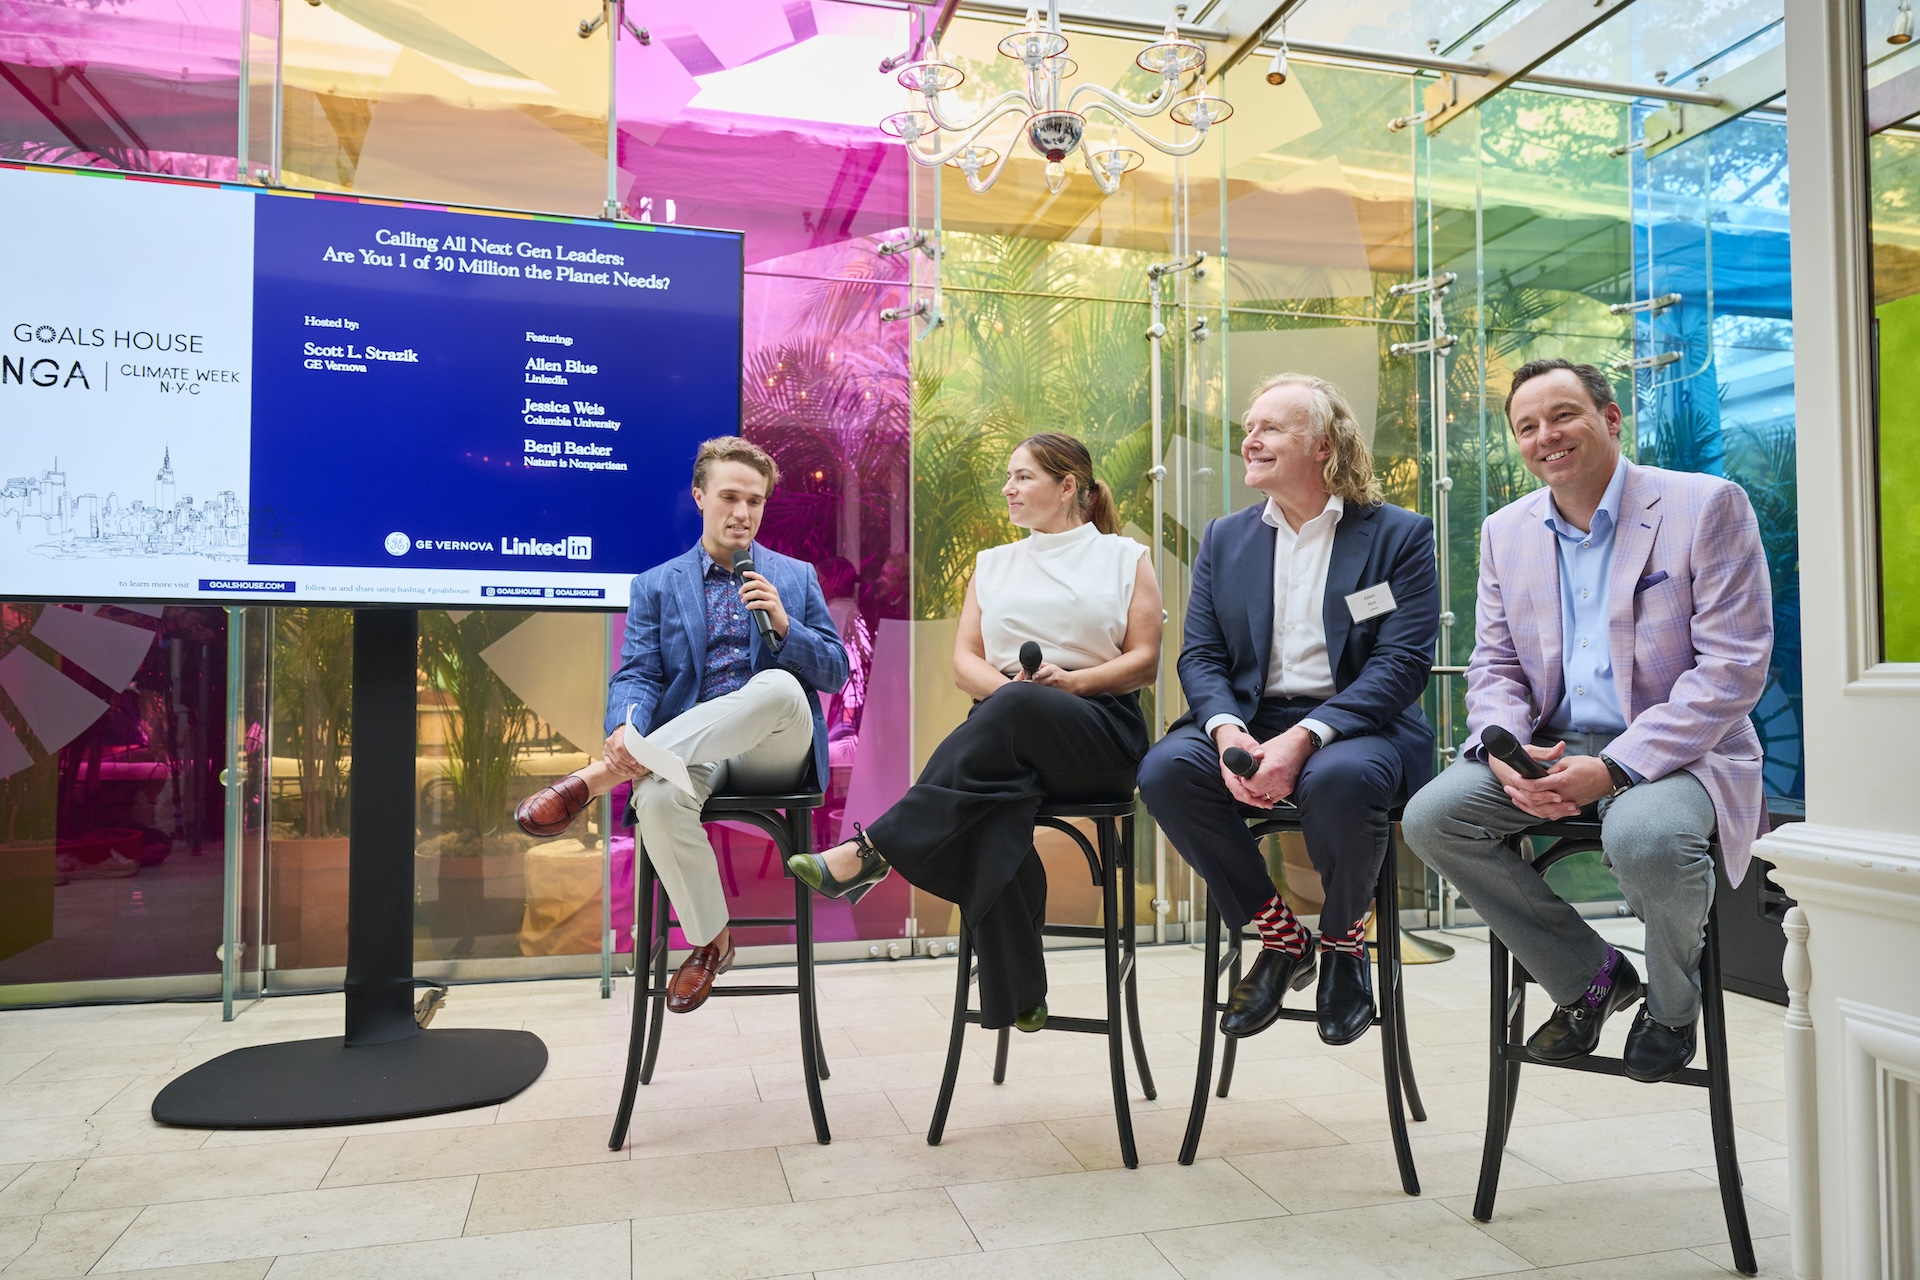
Last week, at Climate Week NYC, GE Vernova was an influential voice in shaping the global conversation on smarter, more sustainable energy — highlighting the need for breakthrough solutions and urging bold leadership to meet accelerating demand. While the UN General Assembly drew headlines across town, GE Vernova contributed to the “Power On” theme at Climate Week by announcing recent advances in nuclear and carbon capture, and promoting a message of optimism, urgency, and collaboration.
Axios House: Moving the Needle
Energizing Georgia’s Future: These Mighty Gas Turbines Can Power the Peach State’s Blossoming Rural Economy
Data centers, those serried racks of servers, storage devices, and network hardware that keep the internet humming, are dominating the conversation about future energy demand.
GE Vernova declares fourth quarter 2025 dividend
CAMBRIDGE, Mass. (September 25, 2025) – GE Vernova (NYSE: GEV) today announced that its Board of Directors has declared a $0.25 per share quarterly dividend. The quarterly dividend will be payable on November 17, 2025, to shareholders of record as of October 20, 2025.
Future dividend declarations will be made at the discretion of the Board of Directors and will be based on GE Vernova’s earnings, financial condition, cash requirements, prospects, and other factors.
Additional Information
GE Vernova’s website at www.gevernova.com/investors contains a significant amount of information about GE Vernova, including financial and other information for investors. GE Vernova encourages investors to visit this website from time to time, as information is updated, and new information is posted. Investors are also encouraged to visit GE Vernova’s LinkedIn and other social media accounts, which are platforms on which the Company posts information from time to time.
Additional Financial Information
Additional financial information can be found on the Company’s website at: www.gevernova.com/investors under Reports and Filings.
Forward Looking Statements
This document contains forward-looking statements – that is, statements related to future events that by their nature address matters that are, to different degrees, uncertain, such as statements about possible future dividend declarations and payments. Forward-looking statements are subject to risks, uncertainties, and other factors, which could cause actual results to differ materially from current expectations. These risks, uncertainties, and factors include those discussed in our most recent Annual Report on Form 10-K and in our subsequently filed Quarterly Reports on Form 10-Q, including in the "Risk Factors" and "Management's Discussion and Analysis of Financial Condition and Results of Operation" sections included therein, as may be updated from time to time in our filings with the U.S. Securities and Exchange Commission and as posted on our website at www.gevernova.com/investors/fls. GE Vernova does not undertake any obligation to update or revise its forward-looking statements except as required by law or regulation.
end
About GE Vernova
GE Vernova Inc. (NYSE: GEV) is a purpose-built global energy company that includes Power, Electrification and Wind segments and is supported by its accelerator businesses. Building on over 130 years of experience tackling the world’s challenges, GE Vernova is uniquely positioned to help lead the energy transition by continuing to electrify the world while simultaneously working to decarbonize it. GE Vernova helps customers power economies and deliver electricity that is vital to health, safety, security, and improved quality of life. GE Vernova is headquartered in Cambridge, Massachusetts, U.S., with approximately 85,000 employees across approximately 100 countries around the world. Supported by the Company’s purpose, The Energy to Change the World, GE Vernova technology helps deliver a more affordable, reliable, sustainable, and secure energy future.
© 2025 GE Vernova and/or its affiliates. All rights reserved.
GE and the GE Monogram are trademarks of General Electric Company used under trademark license.
Investor inquiries
Michael Lapides
GE Vernova | Vice President of Investor Relations