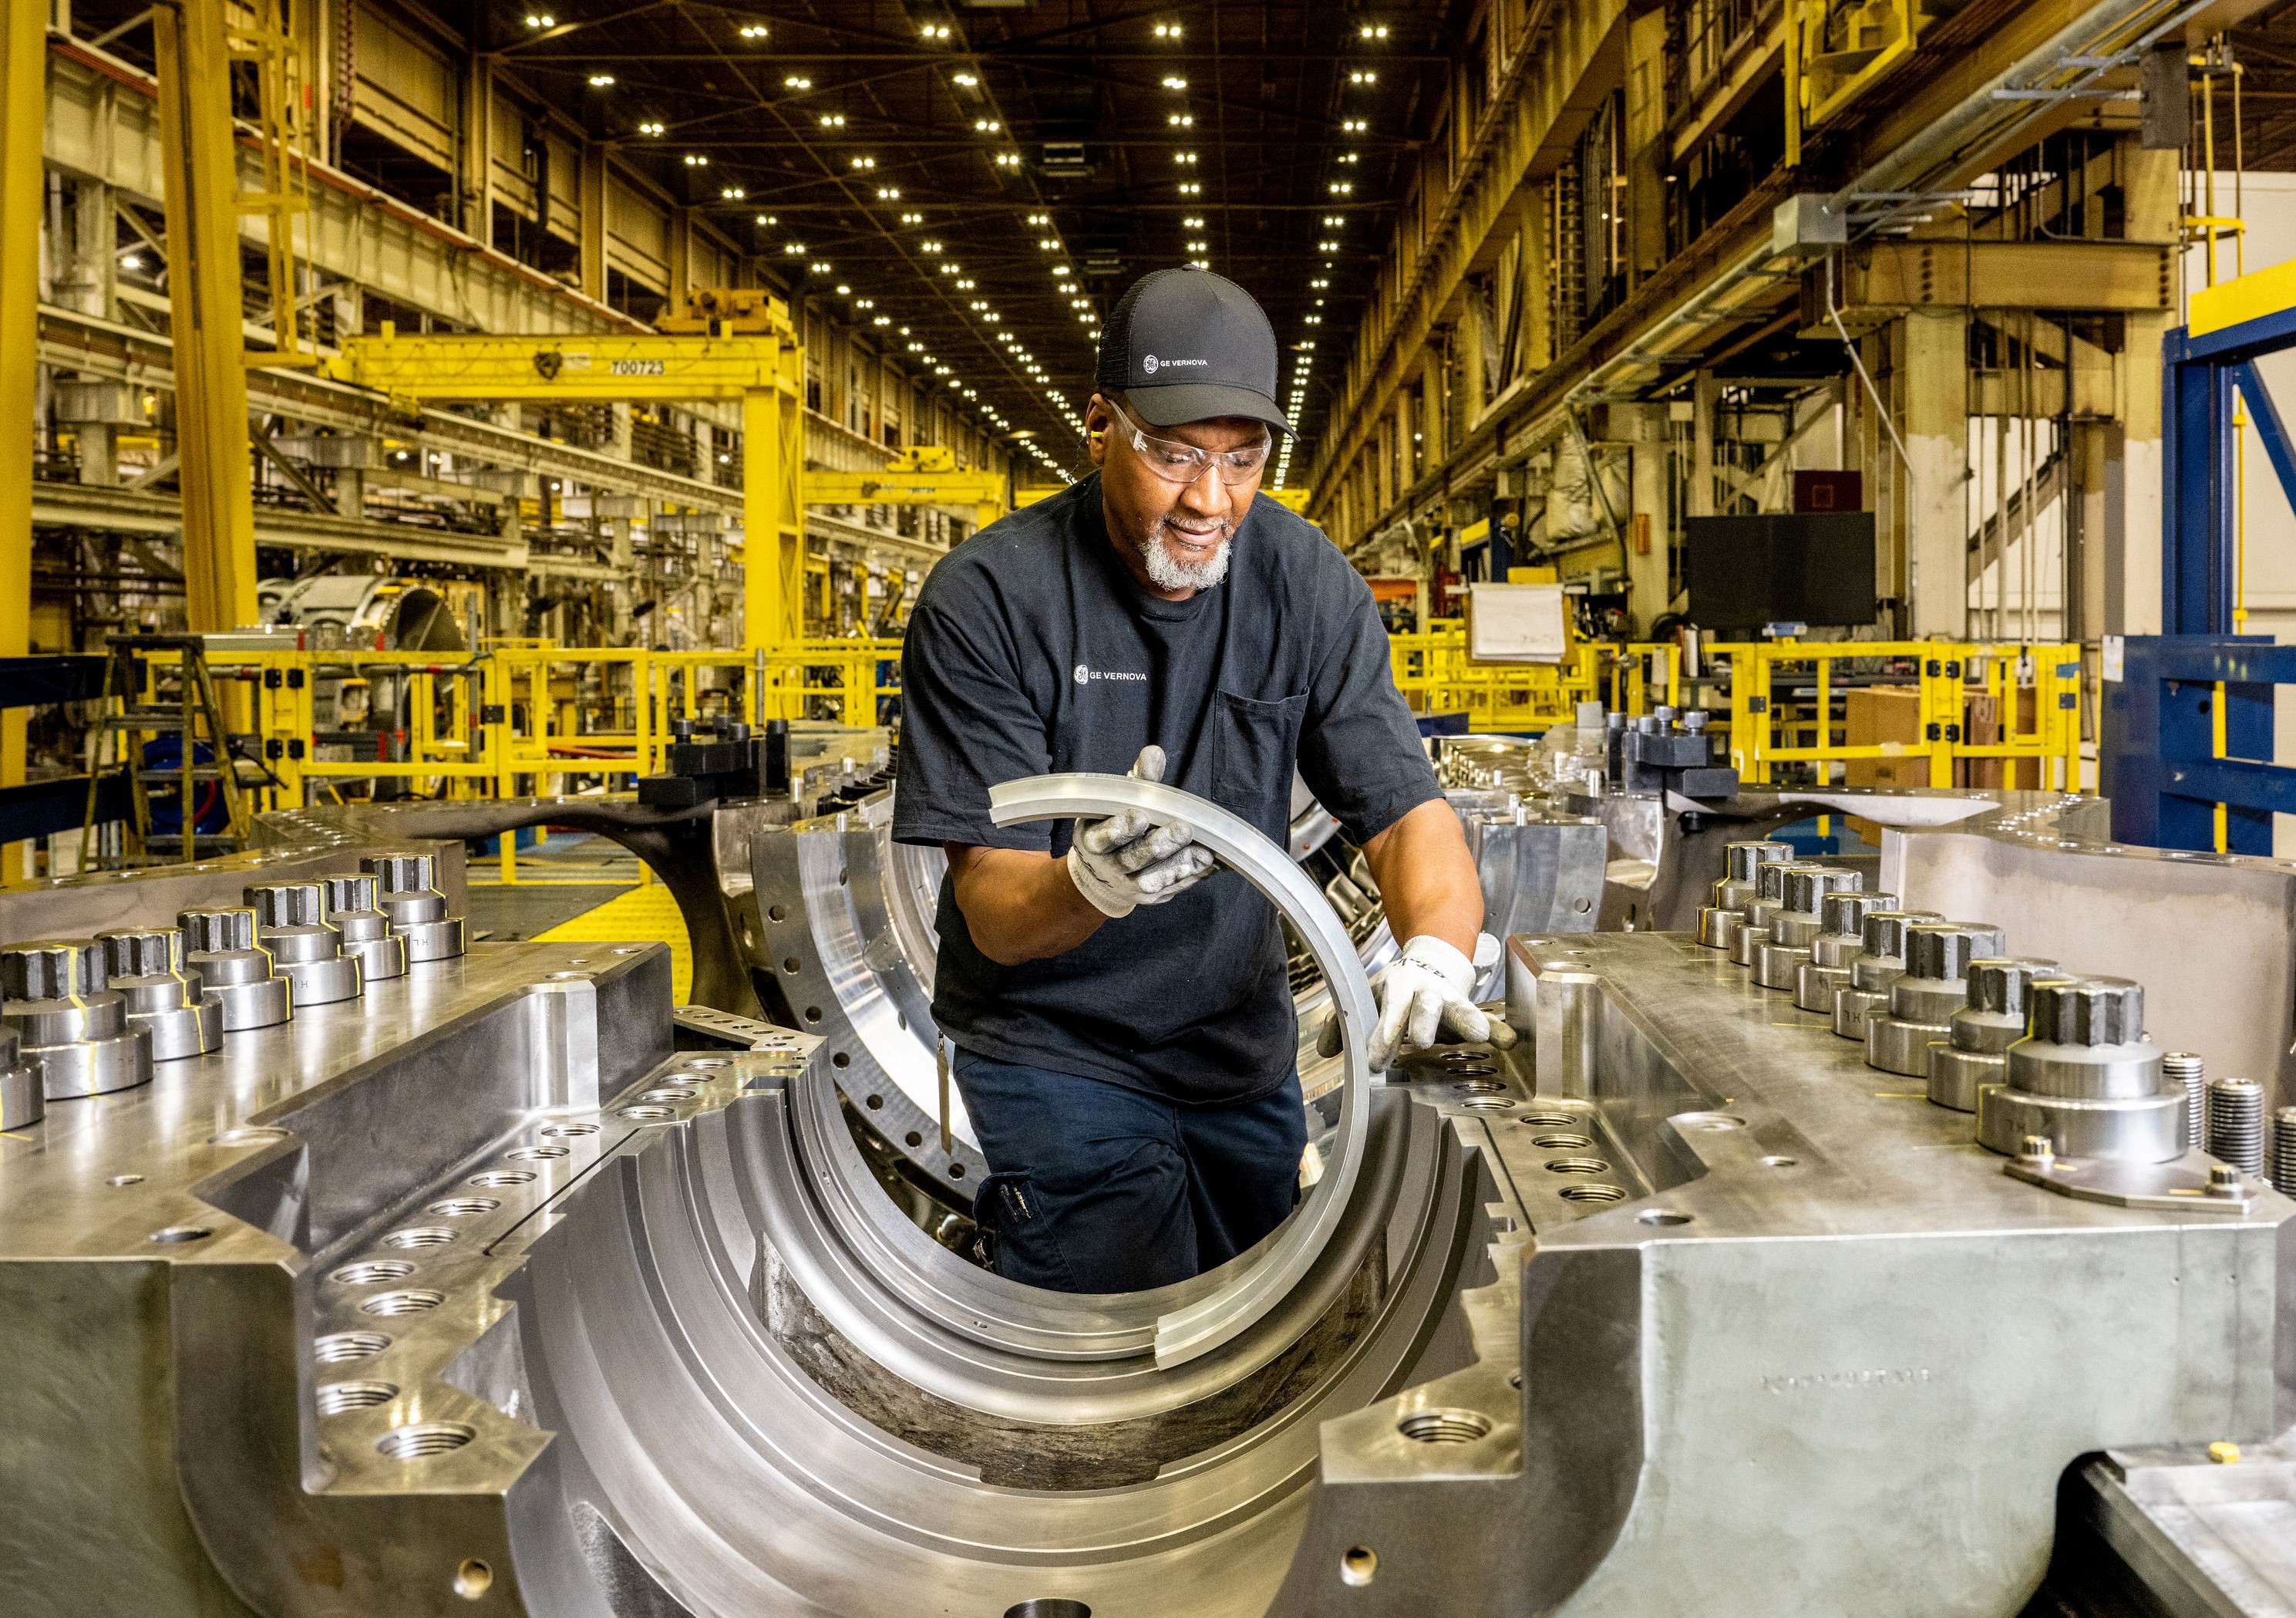
Today, GE Vernova released its financial results for the fourth quarter and full year ending December 31, 2024. We built a strong foundation in 2024, marked by solid growth, as well as significant margin expansion and cash generation. We also reaffirmed our 2025 financial guidance for revenue, adjusted EBITDA margin*, and free cash flow*.
GE Vernova reports fourth quarter and full year 2024 financial results
-
Fourth Quarter 2024 Highlights:
• Record orders of $13.2B, +22% organically, approximately 1.3X revenue, led by Power and Electrification equipment
• Record revenue of $10.6B, +5%, +9% organically* with growth in both equipment and services
• Net income of $0.5B, +$0.3B; net income margin of 4.6%, +260 bps
• Adjusted EBITDA* of $1.1B and adjusted EBITDA margin* of 10.2%
• Cash from operating activities of $0.9B, down $(1.0)B; free cash flow* of $0.6B, down $(1.1)B due to lower down payments from customer orders and improved linearity
-
Full Year 2024 Highlights:
• Orders of $44.1B, +7% organically, led by Power and Electrification equipment, and services in each segment
• Revenue of $34.9B, +5%, +7% organically* driven by Electrification and Power
• Net income of $1.6B, +$2.0B; net income margin of 4.5%, +590 bps
• Adjusted EBITDA* of $2.0B and adjusted EBITDA margin* of 5.8%
• Cash from operating activities of $2.6B, +$1.4B; positive free cash flow* of $1.7B, +$1.3B
• $8.2B cash balance up from $7.4B in the third quarter of 2024 and from $4.2B at spin-off on April 2, 2024
• Reaffirming 2025 financial guidance
Built a strong foundation in 2024 with solid growth, significant margin expansion and cash generation
CAMBRIDGE, Mass., (January 22, 2025) – GE Vernova Inc. (NYSE: GEV), a unique industry leader enabling customers to accelerate the energy transition, today reported financial results for the fourth quarter and full year ending December 31, 2024.
“GE Vernova built a strong foundation in 2024 with solid orders and revenue growth, as well as significant margin expansion and cash generation. We saw strength in Power and Electrification and improvement in Wind, while growing our equipment backlog at better margins,” said GE Vernova CEO Scott Strazik. “Our progress reinforces the important role we play in electrifying and decarbonizing the world as we deliver on accelerating demand for our equipment and services. Our lean culture is driving operational improvement across safety, quality, delivery, and cost. As we enter 2025, I’m grateful for our team’s dedication and optimistic about the future as we continue creating value for our stakeholders.”
In 2024, GE Vernova orders of $44.1 billion increased +7% organically, with robust equipment growth in Power and Electrification and double-digit services growth in each segment. Revenue of $34.9 billion was up +5%, +7% organically*, driven by higher services and equipment volume, with positive price in all segments. Margins expanded significantly from higher volume, price, and productivity, more than offsetting inflation. Cash flow improved by over $1 billion year-over-year, primarily from adjusted EBITDA* growth.
Power
- Total year orders of $21.8 billion increased +28% organically, from strong demand for Gas Power equipment and double-digit services growth. Revenues of $18.1 billion increased +4%, +7% organically*, led by Gas Power. Segment EBITDA margin grew +260 basis points, +180 basis points organically*.
- Secured a major contract for the Net Zero Teesside Power project in the United Kingdom in the fourth quarter, which is expected to be the world’s first gas-fired power station with carbon capture and storage.
Wind
- Total year orders of $7.1 billion decreased (38)% organically, due to lower Onshore Wind equipment. Revenues of $9.7 billion were down (1)% on a U.S. GAAP basis and organically*, driven primarily by Offshore Wind. Segment EBITDA losses improved by $0.4 billion.
- Secured more than 1 gigawatt of U.S. Onshore Wind repowering orders in 2024, an increase of 76% from 2023.
Electrification
- Total year orders of $15.7 billion increased +19% organically, driven by growing demand for grid equipment and services. Revenues of $7.5 billion increased +18% on a U.S. GAAP basis and organically*, led by Grid Solutions. Segment EBITDA margin grew +530 basis points, +520 basis points organically*.
- Expanded its rapidly growing backlog, which included two HVDC orders in Germany and Korea in the fourth quarter.
Company Updates:
In the fourth quarter of 2024, GE Vernova:
- Achieved fatality-free operations, which remains a top priority.
- Declared a $0.25 per share quarterly dividend, payable on January 28, 2025 to shareholders of record as of December 20, 2024.
- Approved an initial $6 billion share repurchase authorization, with 8,000 shares repurchased in late December 2024 for approximately $3 million.
- Monetized an incremental 8% ownership stake in GE Vernova T&D India Limited and a 3% ownership stake in China XD Electric Co Ltd., both part of the Electrification segment, resulting in approximately $0.6 billion of pre-tax proceeds.
- Invested $0.3 billion in capital expenditures including initiatives to expand capacity in Power and Electrification.
- Funded $0.3 billion in research and development (R&D) spending to advance breakthrough energy transition technologies.
"We had a strong finish to 2024 as we execute our strategy to deliver disciplined revenue growth with increased profitability and positive cash generation. In the fourth quarter, we achieved record orders and revenue, and expanded margins in each segment,” said GE Vernova CFO Ken Parks. “We closed the year with over $8 billion in cash, driven by positive free cash flow and several value-accretive portfolio actions. We will invest in growth and innovation, while returning capital to shareholders and maintaining our investment grade balance sheet. Today, we are also reaffirming our 2025 financial guidance.”
Guidance:
GE Vernova is reaffirming its 2025 financial guidance of revenue of $36-$37 billion, high-single digits adjusted EBITDA margin*, free cash flow* of $2.0-$2.5 billion, and segment guidance of:
- Power: Mid-single digit organic revenue* growth and 13%-14% segment EBITDA margin.
- Wind: Organic revenue* down mid-single digits and $200-$400 million of segment EBITDA losses.
- Electrification: Mid-to-high-teens organic revenue* growth and 11%-13% segment EBITDA margin.
Total Company Results
Three months ended December 31 | Twelve months ended December 31 | ||||||
| (Dollars in millions, except per share) | 2024 | 2023 | Year-on-Year | 2024 | 2023 | Year-on-Year | |
| GAAP Metrics | |||||||
| Total revenues | $10,559 | $10,045 | 5 % | $34,935 | $33,239 | 5 % | |
| Net income (loss) | $484 | $205 | $279 | $1,559 | $(474) | $2,033 | |
| Net income (loss) margin | 4.6 % | 2.0 % | 260 bps | 4.5 % | (1.4) % | 590 bps | |
| Diluted EPS(a) | $1.73 | $0.72 | F | $5.58 | $(1.60) | F | |
| Cash from (used for) operating activities | $922 | $1,933 | $(1,011) | $2,583 | $1,186 | $1,397 | |
| Non-GAAP Metrics | |||||||
| Organic revenues | $10,593 | $9,762 | 9 % | $34,771 | $32,630 | 7 % | |
| Adjusted EBITDA | $1,079 | $584 | $495 | $2,035 | $807 | $1,228 | |
| Adjusted EBITDA margin | 10.2 % | 5.8 % | 440 bps | 5.8 % | 2.4 % | 340 bps | |
| Adjusted organic EBITDA margin | 10.6 % | 6.2 % | 440 bps | 6.2 % | 3.3 % | 290 bps | |
| Free cash flow | $572 | $1,651 | $(1,079) | $1,701 | $442 | $1,259 | |
(a) The computation of earnings (loss) per share for all periods through April 1, 2024 was calculated using 274 million common shares that were issued upon Spin-Off and excludes Net loss (income) attributable to noncontrolling interests. For periods prior to the Spin-Off, the Company participated in various GE stock-based compensation plans. For periods prior to the Spin-Off, there were no dilutive equity instruments as there were no equity awards of GE Vernova outstanding.
Results by Reporting Segment
The following segment discussions and variance explanations are intended to reflect management’s view of the relevant comparisons of financial results. Downloadable historical segment expense financial information can be accessed here.
Power
Three months ended December 31 | Twelve months ended December 31 | ||||||
| (Dollars in millions) | 2024 | 2023 | Year-on-Year | 2024 | 2023 | Year-on-Year | |
| Orders | $6,552 | $5,452 | 20 % | $21,758 | $17,426 | 25 % | |
| Revenues | $5,431 | $5,591 | (3) % | $18,127 | $17,436 | 4 % | |
| Cost of revenues(a) | $3,971 | $4,157 |
| $13,608 | $13,425 |
| |
| Selling, general, and administrative expenses(a) | $536 | $552 |
| $2,022 | $2,124 |
| |
| Research and development expenses(a) | $127 | $101 |
| $384 | $315 |
| |
| Other segment (income)/expenses(b) | $(13) | $(18) |
| $(155) | $(149) |
| |
| Segment EBITDA | $810 | $799 | $11 | $2,268 | $1,722 | $546 | |
| Segment EBITDA margin | 14.9 % | 14.3 % | 60 bps | 12.5 % | 9.9 % | 260 bps | |
(a) Excludes depreciation and amortization expenses.
(b) Primarily includes equity method investment income and other interest and investment income.
Fourth Quarter 2024 Performance:
Orders of $6.6 billion increased +24% organically, led by Gas Power equipment with 24 heavy-duty units, and Hydro. Services orders decreased (6)% organically due, to strong prior year comparisons driven by the timing of transactional orders. Revenues of $5.4 billion decreased (3)%, increased +2% organically*, with Power services growth and higher HA deliveries more than offsetting lower aeroderivative shipments. Segment EBITDA was $0.8 billion and segment EBITDA margin was 14.9%, up +60 basis points, +30 basis points organically*, led by Gas Power with services volume, productivity, and price more than offsetting inflation.
Full Year 2024 Performance:
Orders of $21.8 billion increased +28% organically, led by robust demand for Gas Power equipment, and Power services growth of +10% organically. Revenues of $18.1 billion increased +4%, +7% organically*, led by Gas Power. Segment EBITDA was $2.3 billion and segment EBITDA margin was 12.5%, up +260 basis points, +180 basis points organically*, driven by services strength, more profitable equipment volume, and continued productivity more than offsetting inflation.
Wind
Three months ended December 31 |
| Twelve months ended December 31 | |||||
| (Dollars in millions) | 2024 | 2023 | Year-on-Year | 2024 | 2023 | Year-on-Year | |
| Orders | $2,031 | $3,452 | (41) % | $7,088 | $11,422 | (38) % | |
| Revenues | $3,109 | $2,587 | 20 % | $9,701 | $9,826 | (1) % | |
| Cost of revenues(a) | $2,930 | $2,679 |
| $9,513 | $10,006 |
| |
| Selling, general, and administrative expenses(a) | $135 | $139 |
| $566 | $611 |
| |
| Research and development expenses(a) | $42 | $68 |
| $222 | $248 |
| |
| Other segment (income)/expenses(b) | $(17) | $(9) |
| $(12) | $(6) |
| |
| Segment EBITDA | $19 | $(289) | $308 | $(588) | $(1,033) | $445 | |
| Segment EBITDA margin | 0.6 % | (11.2) % | 1,180 bps | (6.1) % | (10.5) % | 440 bps | |
(a) Excludes depreciation and amortization expenses.
(b) Primarily includes equity method investment income and other interest and investment income.
Fourth Quarter 2024 Performance:
Orders of $2.0 billion decreased (41)% organically, primarily driven by a large U.S. Onshore Wind order in the fourth quarter of 2023. Revenues of $3.1 billion increased +20%, +21% organically*, driven by higher Onshore Wind equipment deliveries and price, partially offset by Offshore Wind. Segment EBITDA was modestly profitable and segment EBITDA margin was 0.6%, up +1,180 basis points, +1,100 basis points organically*, driven by Onshore Wind delivering its most profitable quarter in three years and decreased losses at Offshore Wind.
Full Year 2024 Performance:
Orders of $7.1 billion decreased (38)% organically, due to lower Onshore Wind equipment. Revenues of $9.7 billion decreased (1)% on a U.S. GAAP basis and organically*, primarily due to Offshore Wind. Segment EBITDA was $(0.6) billion and segment EBITDA margin was (6.1)%, up +440 basis points, +380 basis points organically*, primarily due to improvement at Onshore Wind.
Electrification
Three months ended December 31 | Twelve months ended December 31 | ||||||
| (Dollars in millions) | 2024 | 2023 | Year-on-Year | 2024 | 2023 | Year-on-Year | |
| Orders | $4,786 | $2,193 | 118 % | $15,689 | $13,203 | 19 % | |
| Revenues | $2,181 | $1,964 | 11 % | $7,550 | $6,378 | 18 % | |
| Cost of revenues(a) | $1,539 | $1,426 |
| $5,359 | $4,690 |
| |
| Selling, general, and administrative expenses(a) | $322 | $295 |
| $1,295 | $1,213 |
| |
| Research and development expenses(a) | $86 | $82 |
| $345 | $320 |
| |
| Other segment (income)/expenses(b) | $(49) | $(7) |
| $(128) | $(79) |
| |
| Segment EBITDA | $283 | $168 | $115 | $679 | $234 | $445 | |
| Segment EBITDA margin | 13.0 % | 8.6 % | 440 bps | 9.0 % | 3.7 % | 530 bps | |
(a) Excludes depreciation and amortization expenses.
(b) Primarily includes equity method investment income and other interest and investment income.
Fourth Quarter 2024 Performance:
Orders of $4.8 billion increased +122% organically, driven by higher demand for grid equipment and services. Revenues of $2.2 billion grew +11%, +12% organically*, driven by higher volume and price at Grid Solutions. Segment EBITDA was $0.3 billion and segment EBITDA margin was 13.0%, up +440 basis points, +500 basis points organically*, due to higher volume, price, and productivity.
Full Year 2024 Performance:
Orders of $15.7 billion increased +19% organically, driven by higher demand for grid equipment and Electrification services. Revenues of $7.5 billion grew +18% on a U.S. GAAP basis and organically*, led by Grid Solutions. Segment EBITDA was $0.7 billion and segment EBITDA margin was 9.0%, up +530 basis points, +520 basis points organically*, due to higher volume, price, and productivity.
| CONSOLIDATED AND COMBINED STATEMENT OF INCOME (LOSS) (UNAUDITED) | |||||||
Three months ended December 31 | Twelve months ended December 31 | ||||||
| (In millions, except per share amounts) | 2024 | 2023 | V% |
| 2024 | 2023 | V% |
| Sales of equipment | $ 5,852 | $ 5,512 |
|
| $ 18,952 | $ 18,258 |
|
| Sales of services | 4,707 | 4,533 |
|
| 15,983 | 14,981 |
|
| Total revenues | 10,559 | 10,045 | 5 % |
| 34,935 | 33,239 | 5 % |
| Cost of equipment | 5,368 | 5,504 |
|
| 17,989 | 18,705 |
|
| Cost of services | 3,067 | 2,841 |
|
| 10,861 | 9,716 |
|
| Gross profit | 2,123 | 1,701 | 25 % |
| 6,085 | 4,818 | 26 % |
|
|
|
|
|
| ||
| Selling, general, and administrative expenses | 1,266 | 1,251 |
|
| 4,632 | 4,845 |
|
| Research and development expenses | 265 | 255 |
|
| 982 | 896 |
|
| Operating income (loss) | 593 | 195 | F |
| 471 | (923) | F |
|
|
|
|
|
| ||
| Interest and other financial charges – net | 38 | (35) |
|
| 120 | (98) |
|
| Non-operating benefit income | 137 | 151 |
|
| 536 | 567 |
|
| Other income (expense) – net | 346 | 16 |
|
| 1,372 | 324 |
|
| Income (loss) before income taxes | 1,114 | 328 | F |
| 2,498 | (130) | F |
| Provision (benefit) for income taxes | 630 | 122 |
|
| 939 | 344 |
|
| Net income (loss) | 484 | 205 | F |
| 1,559 | (474) | F |
| Net loss (income) attributable to noncontrolling interests | — | (8) |
|
| (7) | 36 |
|
| Net income (loss) attributable to GE Vernova | $ 484 | $ 197 | F |
| $ 1,552 | $ (438) | F |
| Earnings (loss) per share attributable to GE Vernova | |||||||
| Basic | $ 1.75 | $ 0.72 | F |
| $ 5.65 | $ (1.60) | F |
| Diluted | $ 1.73 | $ 0.72 | F |
| $ 5.58 | $ (1.60) | F |
|
|
|
|
|
| ||
| Weighted-average number of common shares outstanding: |
|
|
|
|
|
| |
| Basic | 276 | 274 | 1 % |
| 275 | 274 | — % |
| Diluted | 280 | 274 | 2 % |
| 278 | 274 | 1 % |
| CONSOLIDATED AND COMBINED STATEMENT OF FINANCIAL POSITION (UNAUDITED) | ||
| December 31 (In millions, except share and per share amounts) | 2024 | 2023 |
| Cash, cash equivalents, and restricted cash | $ 8,205 | $ 1,551 |
| Current receivables – net | 8,174 | 7,409 |
| Due from related parties | 4 | 80 |
| Inventories, including deferred inventory costs | 8,587 | 8,253 |
| Current contract assets | 8,621 | 8,339 |
| All other current assets | 562 | 352 |
| Assets of business held for sale | — | 1,444 |
| Current assets | 34,153 | 27,428 |
|
| |
| Property, plant, and equipment – net | 5,150 | 5,228 |
| Goodwill | 4,263 | 4,437 |
| Intangible assets – net | 813 | 1,042 |
| Contract and other deferred assets | 555 | 621 |
| Equity method investments | 2,149 | 3,555 |
| Deferred income taxes | 1,639 | 1,582 |
| All other assets | 2,763 | 2,228 |
| Total assets | $ 51,485 | $ 46,121 |
| Accounts payable and equipment project payables | $ 8,578 | $ 7,900 |
| Due to related parties | 24 | 532 |
| Contract liabilities and deferred income | 17,587 | 15,074 |
| All other current liabilities | 5,496 | 4,352 |
| Liabilities of business held for sale | — | 1,448 |
| Current liabilities | 31,685 | 29,306 |
|
| |
| Deferred income taxes | 827 | 382 |
| Non-current compensation and benefits | 3,264 | 3,273 |
| All other liabilities | 5,116 | 4,780 |
| Total liabilities | 40,892 | 37,741 |
| Common stock, par value $0.01 per share, 1,000,000,000 shares authorized, 275,880,314 shares outstanding as of December 31, 2024 | 3 | — |
| Additional paid-in capital | 9,733 | — |
| Retained earnings | 1,611 | — |
| Treasury common stock, 226,290 shares at cost | (43) | — |
| Net parent investment | — | 8,051 |
| Accumulated other comprehensive income (loss) – net attributable to GE Vernova | (1,759) | (635) |
| Total equity attributable to GE Vernova | 9,546 | 7,416 |
| Noncontrolling interests | 1,047 | 964 |
| Total equity | 10,593 | 8,380 |
| Total liabilities and equity | $ 51,485 | $ 46,121 |
| CONSOLIDATED AND COMBINED STATEMENT OF CASH FLOWS (UNAUDITED) | ||
| For the years ended December 31 (In millions) | 2024 | 2023 |
| Net income (loss) | $ 1,559 | $ (474) |
| Adjustments to reconcile net income (loss) to cash from (used for) operating activities | ||
| Depreciation and amortization of property, plant, and equipment | 895 | 724 |
| Amortization of intangible assets | 277 | 240 |
| (Gains) losses on purchases and sales of business interests | (1,147) | (209) |
| Principal pension plans – net | (376) | (405) |
| Other postretirement benefit plans – net | (290) | (313) |
| Provision (benefit) for income taxes | 939 | 344 |
| Cash recovered (paid) during the year for income taxes | (623) | (2) |
| Changes in operating working capital: |
|
|
| Decrease (increase) in current receivables | (1,289) | (837) |
| Decrease (increase) in due from related parties | (8) | (2) |
| Decrease (increase) in inventories, including deferred inventory costs | (641) | (240) |
| Decrease (increase) in current contract assets | (409) | 113 |
| Increase (decrease) in accounts payable and equipment project payables | 1,066 | (663) |
| Increase (decrease) in due to related parties | (398) | (53) |
| Increase (decrease) in contract liabilities and current deferred income | 2,799 | 2,812 |
| All other operating activities | 229 | 151 |
| Cash from (used for) operating activities | 2,583 | 1,186 |
| Additions to property, plant, and equipment and internal-use software | (883) | (744) |
| Dispositions of property, plant, and equipment | 25 | 60 |
| Purchases of and contributions to equity method investments | (114) | (83) |
| Sales of and distributions from equity method investments | 244 | 232 |
| Proceeds from principal business dispositions | 813 | — |
| All other investing activities | (122) | (199) |
| Cash from (used for) investing activities | (37) | (734) |
| Net increase (decrease) in borrowings of maturities of 90 days or less | (23) | 16 |
| Transfers from (to) Parent | 2,933 | (361) |
| All other financing activities | 742 | (63) |
| Cash from (used for) financing activities | 3,652 | (408) |
| Effect of currency exchange rate changes on cash, cash equivalents, and restricted cash | (147) | 22 |
| Increase (decrease) in cash, cash equivalents, and restricted cash, including cash classified within businesses held for sale | 6,051 | 66 |
| Less: Net increase (decrease) in cash classified within businesses held for sale | (603) | 582 |
| Increase (decrease) in cash, cash equivalents, and restricted cash | 6,654 | (516) |
| Cash, cash equivalents, and restricted cash at beginning of year | 1,551 | 2,067 |
| Cash, cash equivalents, and restricted cash as of December 31 | $ 8,205 | $ 1,551 |
Non-GAAP Financial Measures
The non-GAAP financial measures presented in this press release are supplemental measures of our performance and our liquidity that we believe help investors understand our financial condition and operating results and assess our future prospects. We believe that presenting these non-GAAP financial measures, in addition to the corresponding U.S. GAAP financial measures, are important supplemental measures that exclude non-cash or other items that may not be indicative of or are unrelated to our core operating results and the overall health of our company. We believe that these non-GAAP financial measures provide investors greater transparency to the information used by management for its operational decision-making and allow investors to see our results “through the eyes of management.” We further believe that providing this information assists our investors in understanding our operating performance and the methodology used by management to evaluate and measure such performance. When read in conjunction with our U.S. GAAP results, these non-GAAP financial measures provide a baseline for analyzing trends in our underlying businesses and can be used by management as one basis for financial, operational and planning decisions. Finally, these measures are often used by analysts and other interested parties to evaluate companies in our industry.
Management recognizes that these non-GAAP financial measures have limitations, including that they may be calculated differently by other companies or may be used under different circumstances or for different purposes, thereby affecting their comparability from company to company. In order to compensate for these and the other limitations discussed below, management does not consider these measures in isolation from or as alternatives to the comparable financial measures determined in accordance with U.S. GAAP. Readers should review the reconciliations below and should not rely on any single financial measure to evaluate our business. The reasons we use these non-GAAP financial measures and the reconciliations to their most directly comparable GAAP financial measures follow. Unless otherwise noted, tables are presented in U.S. dollars in millions, except for per-share amounts which are presented in U.S. dollars. Certain columns and rows within tables may not add due to the use of rounded numbers. Percentages presented in this report are calculated from the underlying numbers in millions.
We believe the organic measures presented below provide management and investors with a more complete understanding of underlying operating results and trends of established, ongoing operations by excluding the effect of acquisitions, dispositions and foreign currency, which includes translational and transactional impacts, as these activities can obscure underlying trends.
| ORGANIC REVENUES, EBITDA, AND EBITDA MARGIN BY SEGMENT (NON-GAAP) | |||||||||||
Revenue | Segment EBITDA | Segment EBITDA margin | |||||||||
| Three months ended December 31 | 2024 | 2023 | V% | 2024 | 2023 | V% | 2024 | 2023 | V bps | ||
| Power (GAAP) | $5,431 | $5,591 | (3%) | $810 | $799 | 1% | 14.9% | 14.3% | 60 bps | ||
| Less: Acquisitions | — | — | — | — | |||||||
| Less: Business dispositions | — | 282 | — | 14 | |||||||
| Less: Foreign currency effect | (1) | 5 | (14) | (6) | |||||||
| Power organic (Non-GAAP) | $5,432 | $5,304 | 2% | $825 | $790 | 4% | 15.2% | 14.9% | 30 bps | ||
| Wind (GAAP) | $3,109 | $2,587 | 20 % | $19 | $(289) | F | 0.6 % | (11.2) % | 1,180 bps | ||
| Less: Acquisitions | — | — | — | — | |||||||
| Less: Business dispositions | — | — | — | — | |||||||
| Less: Foreign currency effect | (25) | (10) | (8) | (27) | |||||||
| Wind organic (Non-GAAP) | $3,134 | $2,598 | 21 % | $27 | $(262) | F | 0.9 % | (10.1) % | 1,100 bps | ||
| Electrification (GAAP) | $2,181 | $1,964 | 11% | $283 | $168 | 68 % | 13.0 % | 8.6 % | 440 bps | ||
| Less: Acquisitions | — | — | — | — | |||||||
| Less: Business dispositions | — | — | — | — | |||||||
| Less: Foreign currency effect | (8) | 7 | (19) | (4) | |||||||
| Electrification organic (Non-GAAP) | $2,189 | $1,957 | 12% | $302 | $172 | 76 % | 13.8 % | 8.8 % | 500 bps | ||
(a) Includes intersegment sales of $166 million and $103 million for the three months ended December 31, 2024 and 2023, respectively.
| ORGANIC REVENUES(a), EBITDA, AND EBITDA MARGIN BY SEGMENT (NON-GAAP) | |||||||||||
Revenue | Segment EBITDA | Segment EBITDA margin | |||||||||
| Twelve months ended December 31 | 2024 | 2023 | V% | 2024 | 2023 | V% | 2024 | 2023 | V bps | ||
| Power (GAAP) | $ 18,127 | $ 17,436 | 4 % | $ 2,268 | $ 1,722 | 32 % | 12.5 % | 9.9 % | 260 bps | ||
| Less: Acquisitions | 41 | — | 14 | — | |||||||
| Less: Business dispositions | 127 | 643 | (21) | (19) | |||||||
| Less: Foreign currency effect | 12 | 2 | (35) | (118) | |||||||
| Power organic (Non-GAAP) | $ 17,947 | $ 16,791 | 7 % | $ 2,310 | $ 1,859 | 24 % | 12.9 % | 11.1 % | 180 bps | ||
| Wind (GAAP) | $ 9,701 | $ 9,826 | (1) % | $ (588) | $ (1,033) | 43 % | (6.1) % | (10.5) % | 440 bps | ||
| Less: Acquisitions | — | — | — | — | |||||||
| Less: Business dispositions | — | — | — | — | |||||||
| Less: Foreign currency effect | (40) | (52) | (52) | (112) | |||||||
| Wind organic (Non-GAAP) | $ 9,741 | $ 9,878 | (1) % | $ (536) | $ (922) | 42 % | (5.5) % | (9.3) % | 380 bps | ||
| Electrification (GAAP) | $ 7,550 | $ 6,378 | 18 % | $ 679 | $ 234 | F | 9.0 % | 3.7 % | 530 bps | ||
| Less: Acquisitions | 3 | 1 | (3) | — | |||||||
| Less: Business dispositions | — | — | — | — | |||||||
| Less: Foreign currency effect | 22 | 16 | (16) | (27) | |||||||
| Electrification organic (Non-GAAP) | $ 7,525 | $ 6,361 | 18 % | $ 698 | $ 261 | F | 9.3 % | 4.1 % | 520 bps | ||
(a) Includes intersegment sales of $483 million and $414 million for the years ended December 31, 2024 and 2023, respectively.
Three months ended December 31 | Twelve months ended December 31 | ||||||
| ORGANIC REVENUES (NON-GAAP) | 2024 | 2023 | V% | 2024 | 2023 | V% | |
| Total revenues (GAAP) | $ 10,559 | $ 10,045 | 5 % |
| $ 34,935 | $ 33,239 | 5 % |
| Less: Acquisitions | — | — |
|
| 44 | 1 | |
| Less: Business dispositions | — | 282 |
|
| 127 | 643 | |
| Less: Foreign currency effect | (35) | 1 |
|
| (6) | (33) | |
| Organic revenues (Non-GAAP) | $ 10,593 | $ 9,762 | 9 % |
| $ 34,771 | $ 32,630 | 7 % |
Three months ended December 31 | Twelve months ended December 31 | ||||||
| EQUIPMENT AND SERVICES ORGANIC REVENUES (NON-GAAP) | 2024 | 2023 | V% | 2024 | 2023 | V% | |
| Total equipment revenues (GAAP) | $ 5,852 | $ 5,512 | 6 % |
| $ 18,952 | $ 18,258 | 4 % |
| Less: Acquisitions | — | — |
|
| 20 | — |
|
| Less: Business dispositions | — | 199 |
|
| 66 | 382 |
|
| Less: Foreign currency effect | (37) | (2) |
|
| (13) | (36) |
|
| Equipment organic revenues (Non-GAAP) | $ 5,889 | $ 5,316 | 11 % |
| $ 18,880 | $ 17,912 | 5 % |
|
|
|
| ||||
| Total services revenues (GAAP) | $ 4,707 | $ 4,533 | 4 % |
| $ 15,983 | $ 14,981 | 7 % |
| Less: Acquisitions | — | — |
|
| 24 | 1 |
|
| Less: Business dispositions | — | 84 |
|
| 61 | 260 |
|
| Less: Foreign currency effect | 2 | 3 |
|
| 8 | 3 |
|
| Services organic revenues (Non-GAAP) | $ 4,705 | $ 4,446 | 6 % |
| $ 15,890 | $ 14,717 | 8 % |
We believe that Adjusted EBITDA* and Adjusted EBITDA margin*, which are adjusted to exclude the effects of unique and/or non-cash items that are not closely associated with ongoing operations provide management and investors with meaningful measures of our performance that increase the period-to-period comparability by highlighting the results from ongoing operations and the underlying profitability factors. We believe Adjusted organic EBITDA* and Adjusted organic EBITDA margin* provide management and investors with, when considered with Adjusted EBITDA* and Adjusted EBITDA margin*, a more complete understanding of underlying operating results and trends of established, ongoing operations by further excluding the effect of acquisitions, dispositions and foreign currency, which includes translational and transactional impacts, as these activities can obscure underlying trends.
We believe these measures provide additional insight into how our businesses are performing, on a normalized basis. However, Adjusted EBITDA*, Adjusted organic EBITDA*, Adjusted EBITDA margin* and Adjusted organic EBITDA margin* should not be construed as inferring that our future results will be unaffected by the items for which the measures adjust.
Three months ended December 31 | Twelve months ended December 31 | ||||||
| ADJUSTED EBITDA AND ADJUSTED EBITDA MARGIN (NON-GAAP) | 2024 | 2023 | V% | 2024 | 2023 | V% | |
| Net income (loss) (GAAP) | $ 484 | $ 205 | F |
| $ 1,559 | $ (474) | F |
| Add: Restructuring and other charges(a) | 7 | 125 |
|
| 426 | 433 |
|
| Add: Purchases and sales of business interests(b) | (183) | — |
|
| (1,024) | (92) |
|
| Add: Russia and Ukraine charges(c) | — | — |
|
| — | 95 |
|
| Add: Separation costs (benefits)(d) | 55 | — |
|
| (9) | — |
|
| Add: Arbitration refund(e) | — | — |
|
| (254) | — |
|
| Add: Non-operating benefit income(f) | (137) | (151) |
|
| (536) | (567) |
|
| Add: Depreciation and amortization(g) | 274 | 219 |
|
| 1,008 | 847 |
|
| Add: Interest and other financial charges – net(h)(i) | (37) | 26 |
|
| (130) | 53 |
|
| Add: Provision (benefit) for income taxes(i) | 616 | 160 |
|
| 995 | 512 |
|
| Adjusted EBITDA (Non-GAAP) | $ 1,079 | $ 584 | 85 % |
| $ 2,035 | $ 807 | F |
|
| ||||||
| Net income (loss) margin (GAAP) | 4.6 % | 2.0 % | 260 bps |
| 4.5 % | (1.4) % | 590 bps |
| Adjusted EBITDA margin (Non-GAAP) | 10.2 % | 5.8 % | 440 bps |
| 5.8 % | 2.4 % | 340 bps |
|
|
|
|
|
| ||
(a) Consists of severance, facility closures, acquisition and disposition, and other charges associated with major restructuring programs. (b) Consists of gains and losses resulting from the purchases and sales of business interests and assets. (c) Related to recoverability of asset charges recorded in connection with the ongoing conflict between Russia and Ukraine and resulting sanctions primarily related to our Power business. (d) Costs incurred in the Spin-Off and separation from GE, including system implementations, advisory fees, one-time stock option grant, and other one-time costs. In addition, includes $136 million benefit related to deferred intercompany profit that was recognized upon GE retaining the renewable energy U.S. tax equity investments at the time of the Spin-Off in the second quarter. (e) Represents a cash refund received related to an arbitration proceeding with a multiemployer pension plan, constituting the payments previously made, and excludes $52 million related to the interest on such amounts that was recorded in Interest and other financial charges – net in the second quarter. (f) Primarily related to the expected return on plan assets, partially offset by interest cost. (g) Excludes depreciation and amortization expense related to Restructuring and other charges. Includes amortization of basis differences included in Equity method investment income (loss) which is part of Other income (expense). (h) Consists of interest and other financial charges, net of interest income, other than financial interest related to our normal business operations primarily with customers. (i) Excludes interest expense (income) of $(1) million and $9 million and benefit (provision) for income taxes of $(14) million and $37 million for the three months ended December 31, 2024 and 2023, respectively, as well as interest expense (income) of $10 million and $45 million and benefit (provision) for income taxes of $56 million and $168 million for the years ended December 31, 2024 and 2023, respectively, related to our Financial Services business which, because of the nature of its investments, is measured on an after-tax basis due to its strategic investments in renewable energy tax equity investments. | |||||||
Three months ended December 31 | Twelve months ended December 31 | ||||||
| ADJUSTED ORGANIC EBITDA AND ADJUSTED ORGANIC EBITDA MARGIN (NON-GAAP) | 2024 | 2023 | V% | 2024 | 2023 | V% | |
| Adjusted EBITDA (Non-GAAP) | $ 1,079 | $ 584 | 85 % |
| $ 2,035 | $ 807 | F |
| Less: Acquisitions | — | — |
|
| 11 | — |
|
| Less: Business dispositions | — | 14 |
|
| (21) | (19) |
|
| Less: Foreign currency effect | (44) | (37) |
|
| (114) | (257) |
|
| Adjusted organic EBITDA (Non-GAAP) | $ 1,123 | $ 607 | 85 % |
| $ 2,160 | $ 1,084 | 99 % |
|
|
|
|
|
|
| |
| Adjusted EBITDA margin (Non-GAAP) | 10.2 % | 5.8 % | 440 bps |
| 5.8 % | 2.4 % | 340 bps |
| Adjusted organic EBITDA margin (Non-GAAP) | 10.6 % | 6.2 % | 440 bps |
| 6.2 % | 3.3 % | 290 bps |
We believe that free cash flow* provides management and investors with an important measure of our ability to generate cash on a normalized basis. Free cash flow* also provides insight into our ability to produce cash subsequent to fulfilling our capital obligations; however, free cash flow* does not delineate funds available for discretionary uses as it does not deduct the payments required for certain investing and financing activities.
Three months ended December 31 | Twelve months ended December 31 | ||||||
| FREE CASH FLOW (NON-GAAP) | 2024 | 2023 | V% | 2024 | 2023 | V% | |
| Cash from (used for) operating activities (GAAP) | $ 922 | $ 1,933 | (52) % | $ 2,583 | $ 1,186 | F | |
| Add: Gross additions to property, plant and equipment and internal-use software | (350) | (281) | (883) | (744) | |||
| Free cash flow (Non-GAAP) | $ 572 | $ 1,651 | (65) % | $ 1,701 | $ 442 | F | |
2025 GUIDANCE: FREE CASH FLOW (NON-GAAP)
We cannot provide a reconciliation of the differences between the non-GAAP financial measure expectations and the corresponding GAAP financial measure for free cash flow* in the 2025 guidance without unreasonable effort due to the uncertainty of timing for capital expenditures.
*Non-GAAP Financial Measure
CAUTION CONCERNING FORWARD-LOOKING STATEMENTS
This release contains forward-looking statements within the meaning of the Private Securities Litigation Reform Act of 1995 and other securities laws that are subject to risks and uncertainties. These statements may include words such as “believe”, “expect”, “anticipate”, “intend”, “plan”, “estimate”, “guidance”, “will”, “may” and negatives or derivatives of these or similar expressions. These forward-looking statements include, among others, statements about the benefits we expect from our Lean operating model; our expectations regarding the energy transition; the demand for our products and services; our expectations of future increased business, revenues, and operating results; our ability to innovate and anticipate and address customer demands; our ability to increase production capacity, efficiencies, and quality; our underwriting and risk management; current and future customer orders and projects; our actual and planned investments; our expected cash generation; our capital allocation framework, including share repurchases and dividends; operational safety; and our restructuring programs and strategies to reduce operational costs.
Forward-looking statements reflect our current expectations, are based on judgments and assumptions, are inherently uncertain and are subject to risks, uncertainties, and other factors, which could cause our actual results, performance, or achievements to differ materially from current expectations. Some of the risks, uncertainties, and other factors that may cause actual results to differ materially from those expressed or implied by forward-looking statements include the following:
- Our ability to successfully execute our Lean operating model;
- Our ability to innovate and successfully identity and meet customer demands and needs;
- Our ability to successfully compete;
- Market changes resulting in reduced demand for electricity and less carbon-intensive energy;
- Significant disruptions in our supply chain, including the high cost or unavailability of raw materials, components, and products essential to our business;
- Significant disruptions to our manufacturing and production facilities and distribution networks;
- Changes in government policies and priorities that impact funding and demand for energy;
- Geopolitical risks, including conflicts, trade policies, and other constraints on economic activity;
- Product quality issues or product or safety failures related to our complex and specialized products, solutions, and services, the time required to address them, costs associated with related project delays, repairs or replacements, and the impact of any contractual claims for damages or other legal claims asserted in connection therewith, some of which may be for significant amounts, on our financial results, competitive position or reputation;
- Our ability to obtain required permits, licenses, and registrations and successfully execute our projects;
- Our ability to attract and retain highly qualified personnel;
- Our ability to develop, deploy, and protect our intellectual property rights;
- Our capital allocation plans, including the timing and amount of any dividends, share repurchases, acquisitions, organic investments, and other priorities;
- Our ability to successfully identify, complete and integrate any acquisitions, obtain benefits we expect from our joint ventures and other investments, and redeploy proceeds we may receive from any dispositions;
- The price, availability and trading volumes of our common stock, which will affect the timing and size of any share repurchases;
- Downgrades of our credit ratings or ratings outlooks;
- The amount and timing of our cash flows and earnings;
- Our ability to meet our sustainability goals and related market expectations and governmental requirements;
- The impact from cybersecurity or data security breaches;
- Legal and regulatory requirements that may restrict our business and projects or impose additional costs;
- Natural disasters, weather conditions and events like hurricanes, floods, droughts, wildfires, and sea level rise, public health events or other emergencies;
- Tax law and policy changes;
- Adverse rulings and awards in legal and administrative proceedings; and
- Other changes in macroeconomic and market conditions and market volatility.
These or other uncertainties may cause our actual future results to be materially different than those expressed in our forward-looking statements, and these and other factors are more fully discussed in our Quarterly Report on Form 10-Q for the quarter ended September 30, 2024, and in the "Risk Factors" and "Management's Discussion and Analysis of Financial Condition and Results of Operation" sections included in our information statement dated March 8, 2024, as may be updated from time to time in our SEC filings and as posted on our website at www.gevernova.com/investors/fls. We do not undertake any obligation to update or revise our forward-looking statements except as may be required by law or regulation. This press release also includes certain forward-looking projected financial information that is based on current estimates and forecasts. Actual results could differ materially.
Additional Information
GE Vernova’s website at www.gevernova.com/investors contains a significant amount of information about GE Vernova, including financial and other information for investors. GE Vernova encourages investors to visit this website from time to time, as information is updated, and new information is posted. Investors are also encouraged to visit GE Vernova’s LinkedIn and other social media accounts, which are platforms on which the Company posts information from time to time.
Additional Financial Information
Additional financial information can be found on the Company’s website at: www.gevernova.com/investors under Reports and Filings.
Conference Call and Webcast Information
GE Vernova will discuss its results during its investor conference call today starting at 7:30 AM Eastern Time. The conference call will be broadcast live via webcast, and the webcast and accompanying slide presentation containing financial information can be accessed by visiting the investor section of the website www.gevernova.com/investors. An archived version of the webcast will be available on the website after the call.
About GE Vernova
GE Vernova is a purpose-built global energy company that includes Power, Wind, and Electrification segments and is supported by its accelerator businesses. Building on over 130 years of experience tackling the world’s challenges, GE Vernova is uniquely positioned to help lead the energy transition by continuing to electrify the world while simultaneously working to decarbonize it. GE Vernova helps customers power economies and deliver electricity that is vital to health, safety, security, and improved quality of life. GE Vernova is headquartered in Cambridge, Massachusetts, U.S., with approximately 75,000 employees across approximately 100 countries around the world.
GE Vernova’s mission is embedded in its name – it retains its legacy, “GE,” as an enduring and hard-earned badge of quality and ingenuity. “Ver” / “verde” signal Earth’s verdant and lush ecosystems. “Nova,” from the Latin “novus,” nods to a new, innovative era of lower carbon energy. Supported by the Company purpose, The Energy to Change the World, GE Vernova will help deliver a more affordable, reliable, sustainable, and secure energy future. Learn more: GE Vernova’s website and LinkedIn.
end
© 2025 GE Vernova and/or its affiliates. All rights reserved.
GE and the GE Monogram are trademarks of General Electric Company used under trademark license.
Press Resources

Investor inquiries
Michael Lapides
GE Vernova | Vice President of Investor Relations
Media inquiries
Adam Tucker
GE Vernova | Director of Financial CommunicationsGE Vernova to announce fourth quarter and full year 2024 financial results on January 22
CAMBRIDGE, Mass. (January 8, 2025) – GE Vernova Inc. (NYSE: GEV) is scheduled to release its fourth quarter and full year 2024 financial results on Wednesday, January 22, 2025, before market open. GE Vernova CEO Scott Strazik and GE Vernova CFO Ken Parks will discuss the company’s financial results in a webcast at 7:30 AM ET, which can be accessed at https://www.gevernova.com/investors/events/ge-vernova-4th-quarter-2024-earnings-webcast.
The earnings press release and supplementary financial information, including reconciliations of non-GAAP financial measures, will also be posted at the same link on the GE Vernova Investor Relations website. A replay of the call will be made available as a direct download on GE Vernova’s website at https://www.gevernova.com/investors/events.
Additional Information
GE Vernova’s website at https://www.gevernova.com/investors contains a significant amount of information about GE Vernova, including financial and other information for investors. GE Vernova encourages investors to visit this website from time to time, as information is updated, and new information is posted. Investors are also encouraged to visit GE Vernova’s LinkedIn and other social media accounts, which are platforms on which the company posts information from time to time.
end
About GE Vernova
GE Vernova Inc. (NYSE: GEV) is a purpose-built global energy company that includes Power, Electrification and Wind segments and is supported by its accelerator businesses. Building on over 130 years of experience tackling the world’s challenges, GE Vernova is uniquely positioned to help lead the energy transition by continuing to electrify the world while simultaneously working to decarbonize it. GE Vernova helps customers power economies and deliver electricity that is vital to health, safety, security, and improved quality of life. GE Vernova is headquartered in Cambridge, Massachusetts, U.S., with approximately 85,000 employees across approximately 100 countries around the world. Supported by the Company’s purpose, The Energy to Change the World, GE Vernova technology helps deliver a more affordable, reliable, sustainable, and secure energy future.
© 2025 GE Vernova and/or its affiliates. All rights reserved.
GE and the GE Monogram are trademarks of General Electric Company used under trademark license.
Press Resources

Investor inquiries
Michael Lapides
GE Vernova | Vice President of Investor Relations
Media inquiries
Adam Tucker
GE Vernova | Director of Financial CommunicationsIntegração para a descarbonização: respostas para desafios do setor elétrico no Brasil
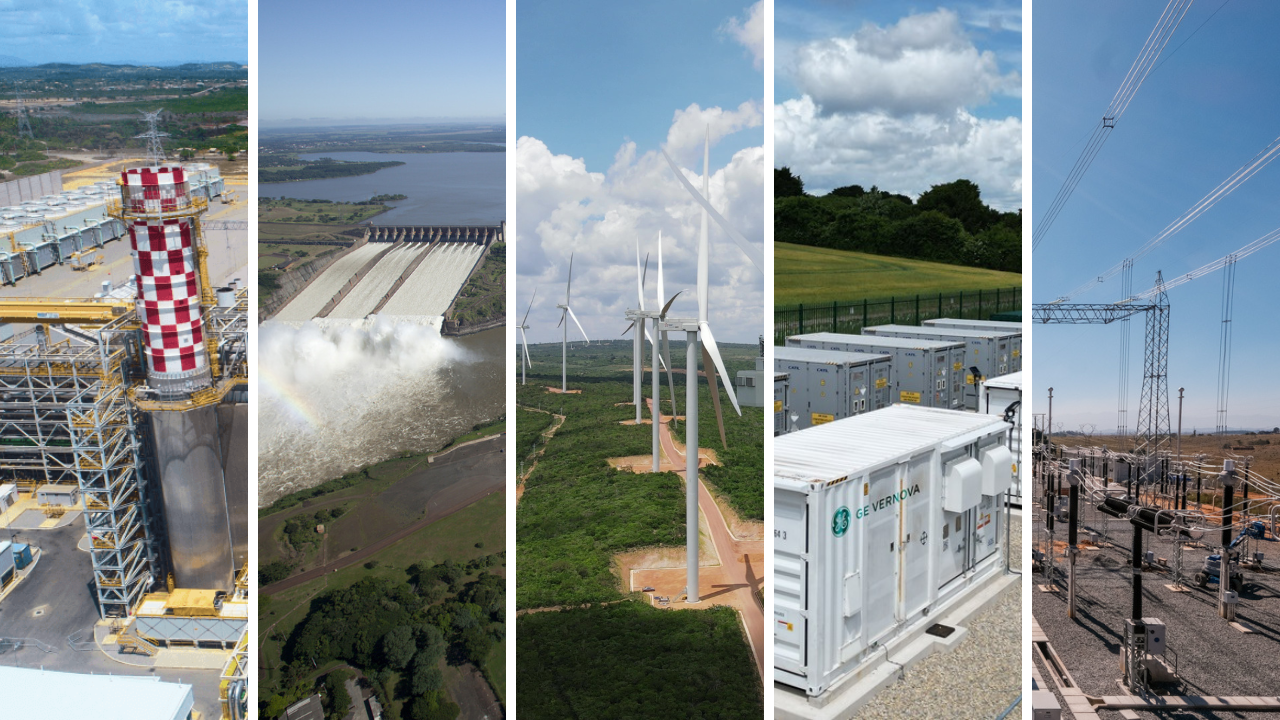
Em novembro deste ano, a matriz elétrica brasileira atingiu o marco de mais de 228 GW em capacidade instalada, sendo uma das maiores e mais diversificadas globalmente. A participação de fontes de energia renováveis como hidrelétrica, eólica, solar e biomassa, respondem por mais de 90% do total, fazendo do Brasil o país do G20 que possui a matriz elétrica com maior uso de energias renováveis, de acordo com estudo da Ember Climate.
Essa realidade é bastante favorável para o país, principalmente no contexto da transição energética, que almeja ajudar no combate às alterações climáticas resultantes do aquecimento global. Uma das maneiras de limitar esse aquecimento é justamente por meio da descarbonização, ponto fundamental da transição.
No Brasil, o setor de energia não é o principal emissor de carbono. De acordo com um estudo da Empresa de Pesquisa Energética (EPE), em 2022, estima-se que a produção e o uso de energia tenham correspondido a apenas 24% das emissões brasileiras de gases de efeito estufa (GEE), número explicado pela matriz energética diversificada e com ampla participação de fontes renováveis. Contudo, a descarbonização do setor elétrico é chave tanto para reduzir ainda mais sua participação direta nas emissões, quanto para apoiar os demais setores que precisam de eletrificação e descarbonização, como o setor de transporte, unindo esforços para ajudar a combater o aquecimento global.
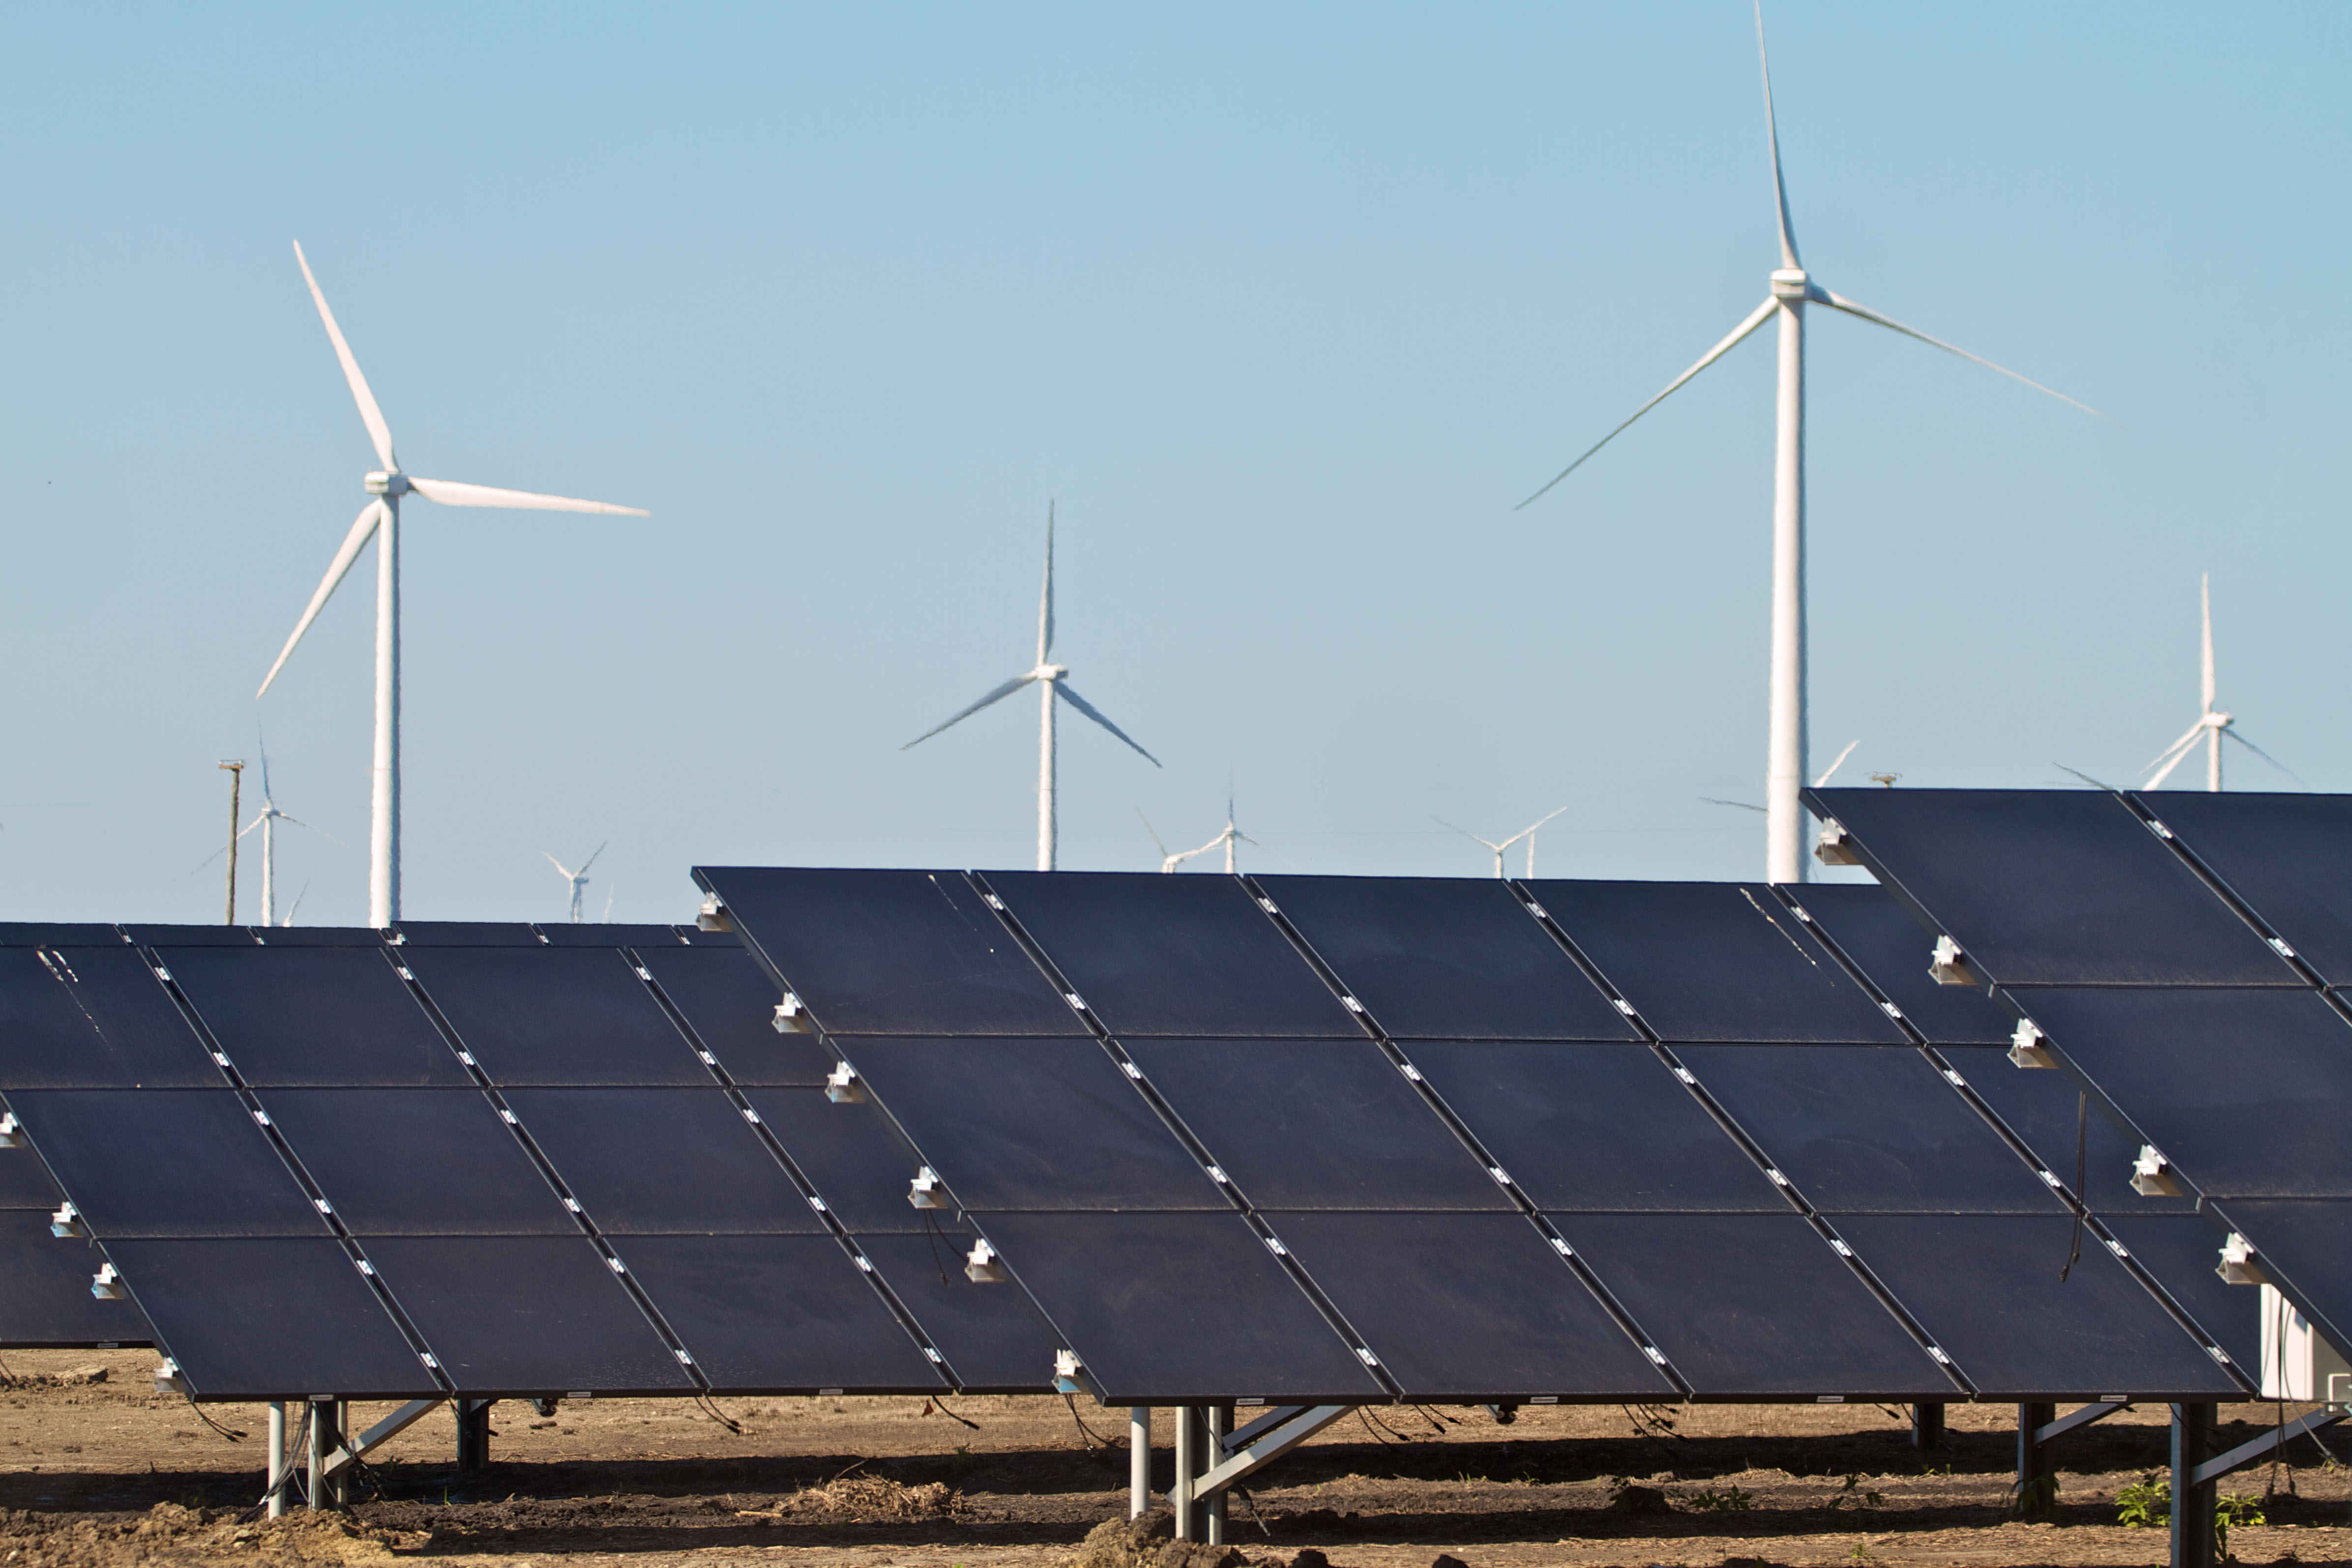
Diante disso, o crescimento de fontes como a eólica e a solar segue como um dos principais pilares da descarbonização, inserindo ainda mais energia renováve na matriz que apoiará as demandas por uma eletrificação eficiente e sustentável. Há algumas décadas, essas fontes – até então consideradas alternativas – ainda não figuravam nas estatísticas de geração de energia com os primeiros projetos sendo iniciados apenas no final dos anos 2000. Hoje, a realidade é bem diferente, e essas mesmas fontes já respondem por mais de 20% da matriz elétrica brasileira, número que deve chegar aos 23% em 2028, segundo a projeção do Operador Nacional do Sistema (ONS).
INTEGRAÇÃO É CHAVE PARA A DESCARBONIZAÇÃO
Espera-se que o crescimento da geração eólica e solar continue especialmente considerando os objetivos da transição energética. Contudo, esse crescimento vem acompanhado de grandes desafios, dada a intermitência característica dessas fontes, por exemplo, considerando que há períodos nos quais os ventos não estão soprando com todo seu potencial e o sol deixa de incidir sobre os parques solares.
Para equilibrar o sistema, outras fontes entram em ação e destacam a importância de seu papel ao complementar a rede elétrica conforme a demanda, fornecendo energia despachável. Uma dessas fontes é a hidráulica, que detém a maior participação na matriz elétrica do país, sendo sua principal fonte de energia renovável há décadas e uma grande aliada da transição energética. Cláudio Trejger, CEO da unidade de Hydro Power para a América Latina, alerta para o fato de que as usinas hidrelétricas brasileiras estão operando há décadas e é fundamental investir também na modernização delas. Esse tipo de serviço ajuda a prolongar a vida útil desses ativos, melhorando a eficiência e otimizando a utilização do recurso hídrico disponível para atender à demanda de eletricidade no país. “Existe uma grande oportunidade para aumentar a potência em várias usinas, porém as geradoras não têm explorado esta possibilidade, pois aguardam a revisão das regras vigentes. A modernização ajuda a aumentar a eficiência e tornar a usina estar disponível por mais tempo, oferecendo maior segurança ao fornecimento de energia. Para isso, nossos times trabalham integrando serviços e tecnologias para otimizar as operações de hidrelétricas como no caso da maior atualização tecnológica da Itaipu Binacional (segunda maior usina hidrelétrica do mundo), e do projeto de modernização da Usina Hidrelétrica de São Simão. Também gostaria de destacar a possibilidade de implantar Usinas Reversíveis, tecnologia oferecida pela GE Vernova, e que pode assumir um importante papel no programa de transição energética do país”, disse Cláudio.
Outra fonte que também tem a capacidade necessária de despacho para complementar as fontes intermitentes e apoiar a atuação da fonte hidráulica, em especial quando o país enfrenta crises hídricas, é o gás natural. Daniel Meniuk, VP de Serviços para América Latina para Gas Power, afirma que “no Brasil, as termelétricas modernas a gás natural, como as usinas do Complexo Azulão e Porto de Sergipe I, fazem a diferença ao ajudar a complementar e a manter nossa rede estável, oferecendo energia segura, confiável e cada dia mais sustentável dada a melhoria constante da tecnologia utilizada." Segundo ele, além de fornecer uma fonte confiável e complementar à geração renovável, as emissões de turbinas a gás podem ser ainda mais reduzidas no futuro usando hidrogênio como combustível e tecnologias de captura de carbono. "No portfólio da GE Vernova, já temos turbinas a gás natural capazes de queimar hidrogênio, de acordo com a demanda do cliente e a infraestrutura da planta. Um exemplo disso ocorre na planta DeBary da Duke Energy, que deve se tornar uma das primeiras usinas de energia em operação comercial a produzir, armazenar e queimar 100% por volume de hidrogênio verde para aplicações relacionadas aos picos de energia", conclui.
MAIS QUE UMA GERAÇAO EFICIENTE, ESTABILIDADE NA ENTREGA
Se a integração de diferentes fontes precisa ser muito bem orquestrada para permitir o crescimento sustentável das fontes renováveis sem prejudicar o abastecimento de energia, gerenciar a qualidade da operação da rede, com foco na estabilidade e segurança da rede elétrica, também é fundamental.
“A rede elétrica é uma das invenções humanas mais complexas que existem. E quando a gente tem mais eólica e solar entrando, a gente tem flutuações de rede e, consequentemente na qualidade da energia que está sendo entregue em todo o país. Por isso, essa rede tem que ser monitorada e condicionada”, afirma Renato Yabiku, CTO para América Latina na unidade de Power Conversion. “A GE Vernova traz um portfólio completo de soluções (hardwares e softwares), desde a geração até a parte de estabilização, seja por meio de programas de orquestração da rede. Como exemplo, destaco os compensadores síncronos, equipamentos que servem justamente para aumentar a capacidade e a estabilidade do Sistema Interligado Nacional (SIN), oferecendo maior qualidade e segurança à transmissão de energia elétrica mesmo em condições adversas. Essa tecnologia ajuda a evitar interrupções e apagões e complementa outras como o STATCOM, que é uma espécie de inversor conectado à rede para dar potência de forma reativa, contribuindo para a estabilização”, explica.
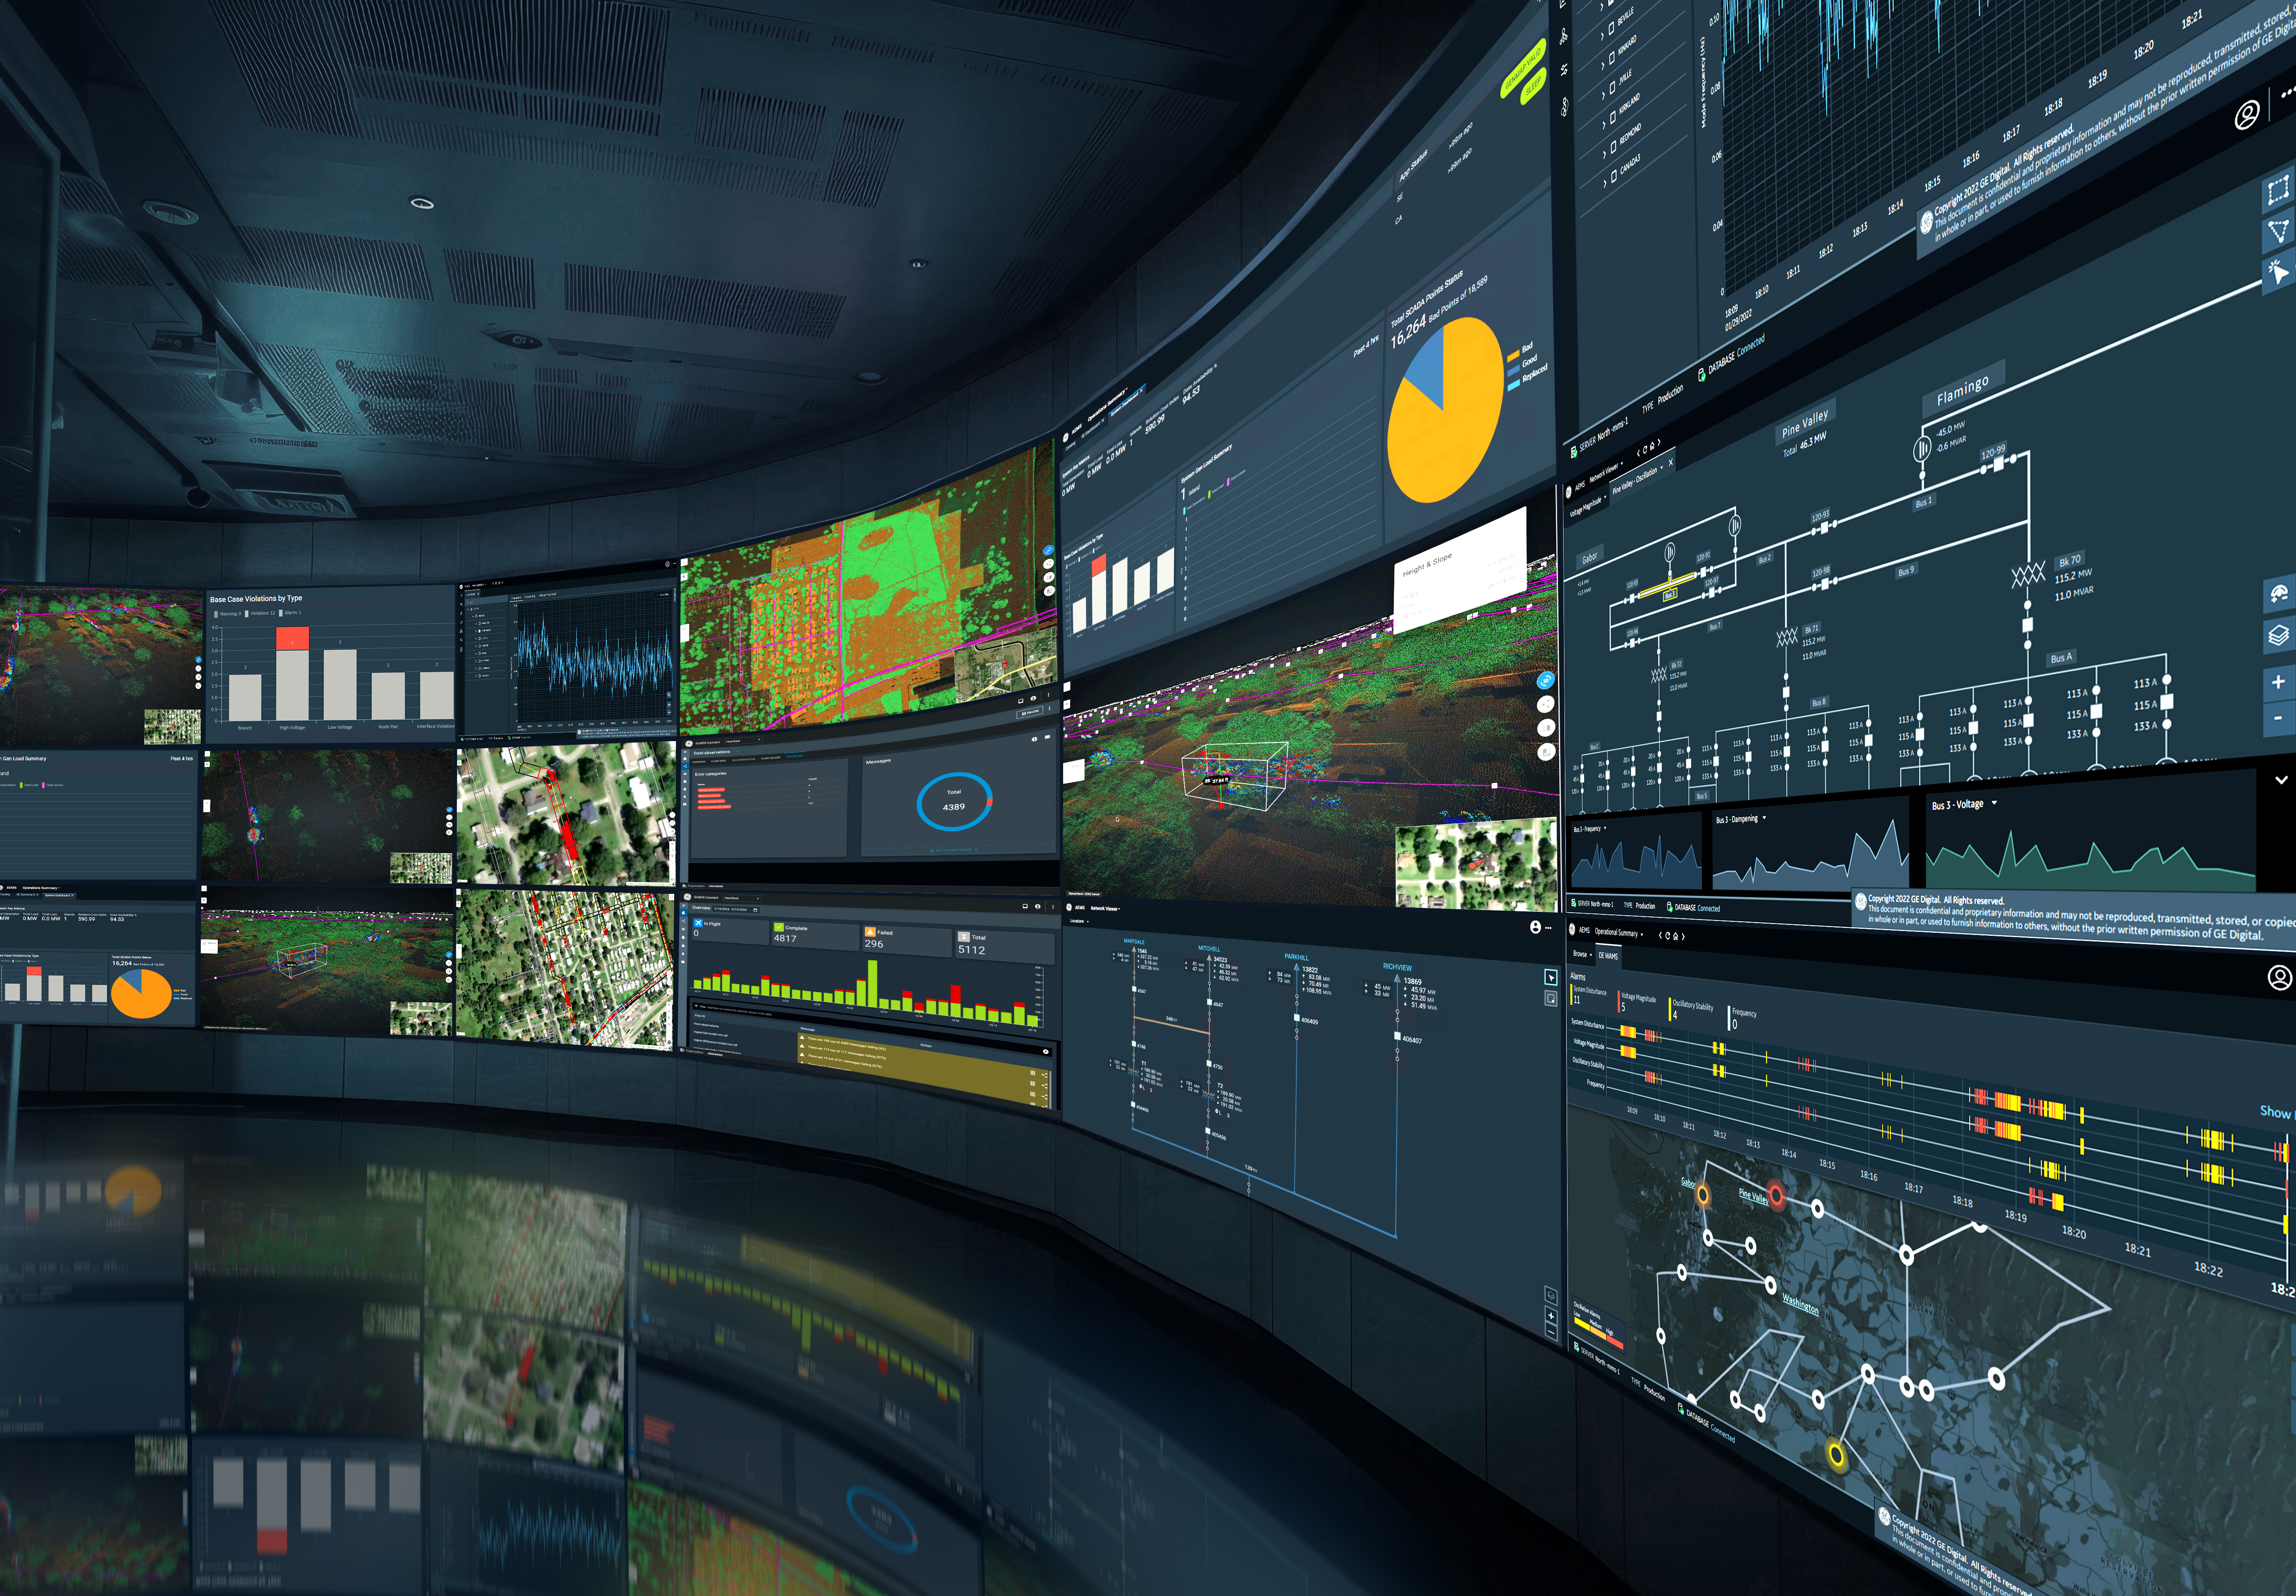
Nesse sentido, Sergio Binda, Líder de Grid Automation para a GE Vernova na América Latina, reforça que a empresa também possui soluções digitais e integradas com poder de computação aumentada, desenvolvidas para gerenciar a rede, visando maior segurança, confiabilidade, capacidade e resiliência na transmissão de energia. “Quando pensamos em uma solução para a rede, inclusive visando a estabilização, existem tecnologias para dar respostas a eventos como uma falha ou um curto-circuito. Esses pacotes de software, como o GridOS e GridBeats, por exemplo, oferecem modelos adequados para cada um dos equipamentos”, afirma. Binda ainda destaca que essas soluções próprias trazem mais valor e uma resposta mais assertiva e segura para aqueles que geram energia e operam o sistema.
DE OLHO NO FUTURO: INTEGRAÇÃO E NOVAS TECNOLOGIAS
Com base em mais de 130 anos de experiência e um portfólio completo de soluções em geração, transmissão, armazenamento de energia, além de softwares e outras tecnologias digitais focadas em eletrificação e descarbonização, a GE Vernova está posicionada de forma única para acelerar a transição energética. Atualmente, sua base tecnológica instalada ajuda a gerar cerca de um quarto da energia no mundo, posicionando a empresa como líder em toda a cadeia de valor da indústria de energia.
De olho no futuro e ciente da importância de desenvolver novas tecnologias que acompanhem a demanda do planeta por energia confiável, acessível e sustentável, a empresa investe aproximadamente US$ 1 bilhão anualmente em Pesquisa & Desenvolvimento. Além disso, trabalha para que a atuação das diferentes áreas da empresa sob os segmentos de Power, Wind e Electrification, facilitem a integração de tecnologias para solucionar os desafios do setor elétrico no Brasil e ao redor do mundo, contribuindo de forma decisiva para a transição energética global.
Quer saber mais?
Recentemente, Daniel Meniuk (VP de Serviços para América Latina, Gas Power) e Renato Yabiku (CTO para a América Latina na unidade de Power Conversion), falaram sobre as soluções da GE Vernova no cenário de transição energética em entrevista ao programa MegaCast, do portal especializado em Energia, MegaWhat. Os executivos abordaram desafios complexos do setor no Brasil e o papel das novas tecnologias para a integração de energias renováveis e a estabilidade de todo o sistema elétrico. Assista aqui.
end
Meet a Dozen People Who Made GE Vernova’s First Year Remarkable

Last April, GE Vernova launched as a standalone company with a mission to electrify and decarbonize the world. The catalyst behind the change the company is creating is its 75,000-strong global team — their ideas, their energy, and their commitment. Meet a dozen of the people who helped GE Vernova get off to a running start.
The 10 Biggest Stories from Year One of GE Vernova

“In my mind, there are no two letters that better embody the spirit of innovation — and have always embodied the spirit of innovation, in the past and the future of this country — than ‘GE,’” said Scott Strazik, CEO of GE Vernova, as his company officially completed its spin-off from the GE Corporation in April. In the eight months since, GE Vernova has continued to make good on its commitment to electrify and decarbonize the world. As the company looks forward to another year leading the energy transition, here’s a glance back at the biggest milestones of 2024.
GE Vernova 2024 Investor Update Recap
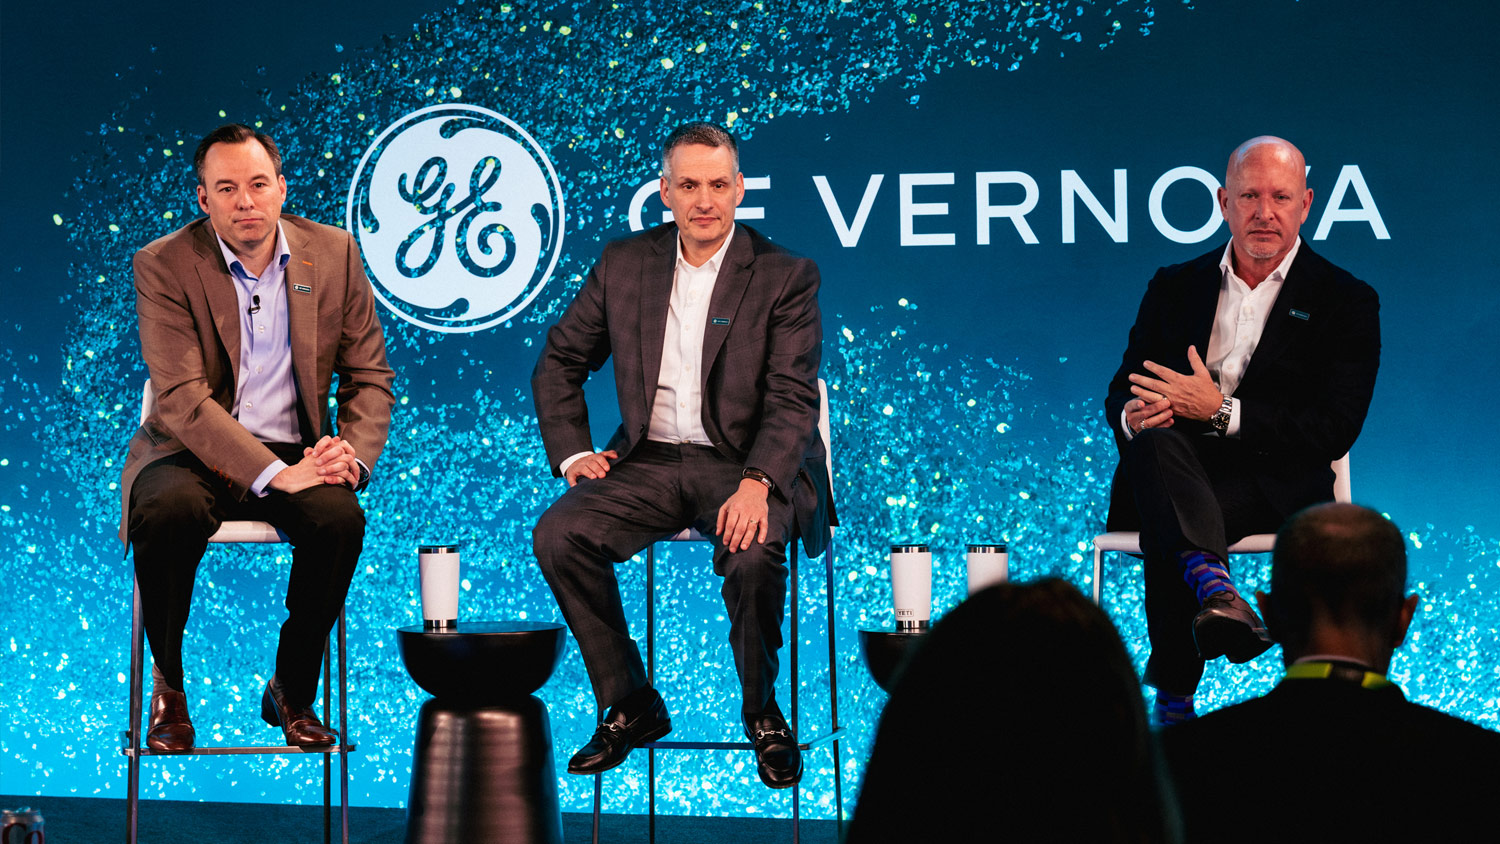
Yesterday, GE Vernova hosted its 2024 Investor Update event in New York City. Given our strong financial trajectory from robust customer demand and better execution, we raised our 2025 guidance and our outlook by 2028. We also framed our capital allocation strategy, announcing that our Board of Directors declared a quarterly dividend and approved an initial share repurchase authorization.
North Star: This First-of-a-Kind Project in the U.K.’s Teesside Region Could Be the Template for Carbon Capture
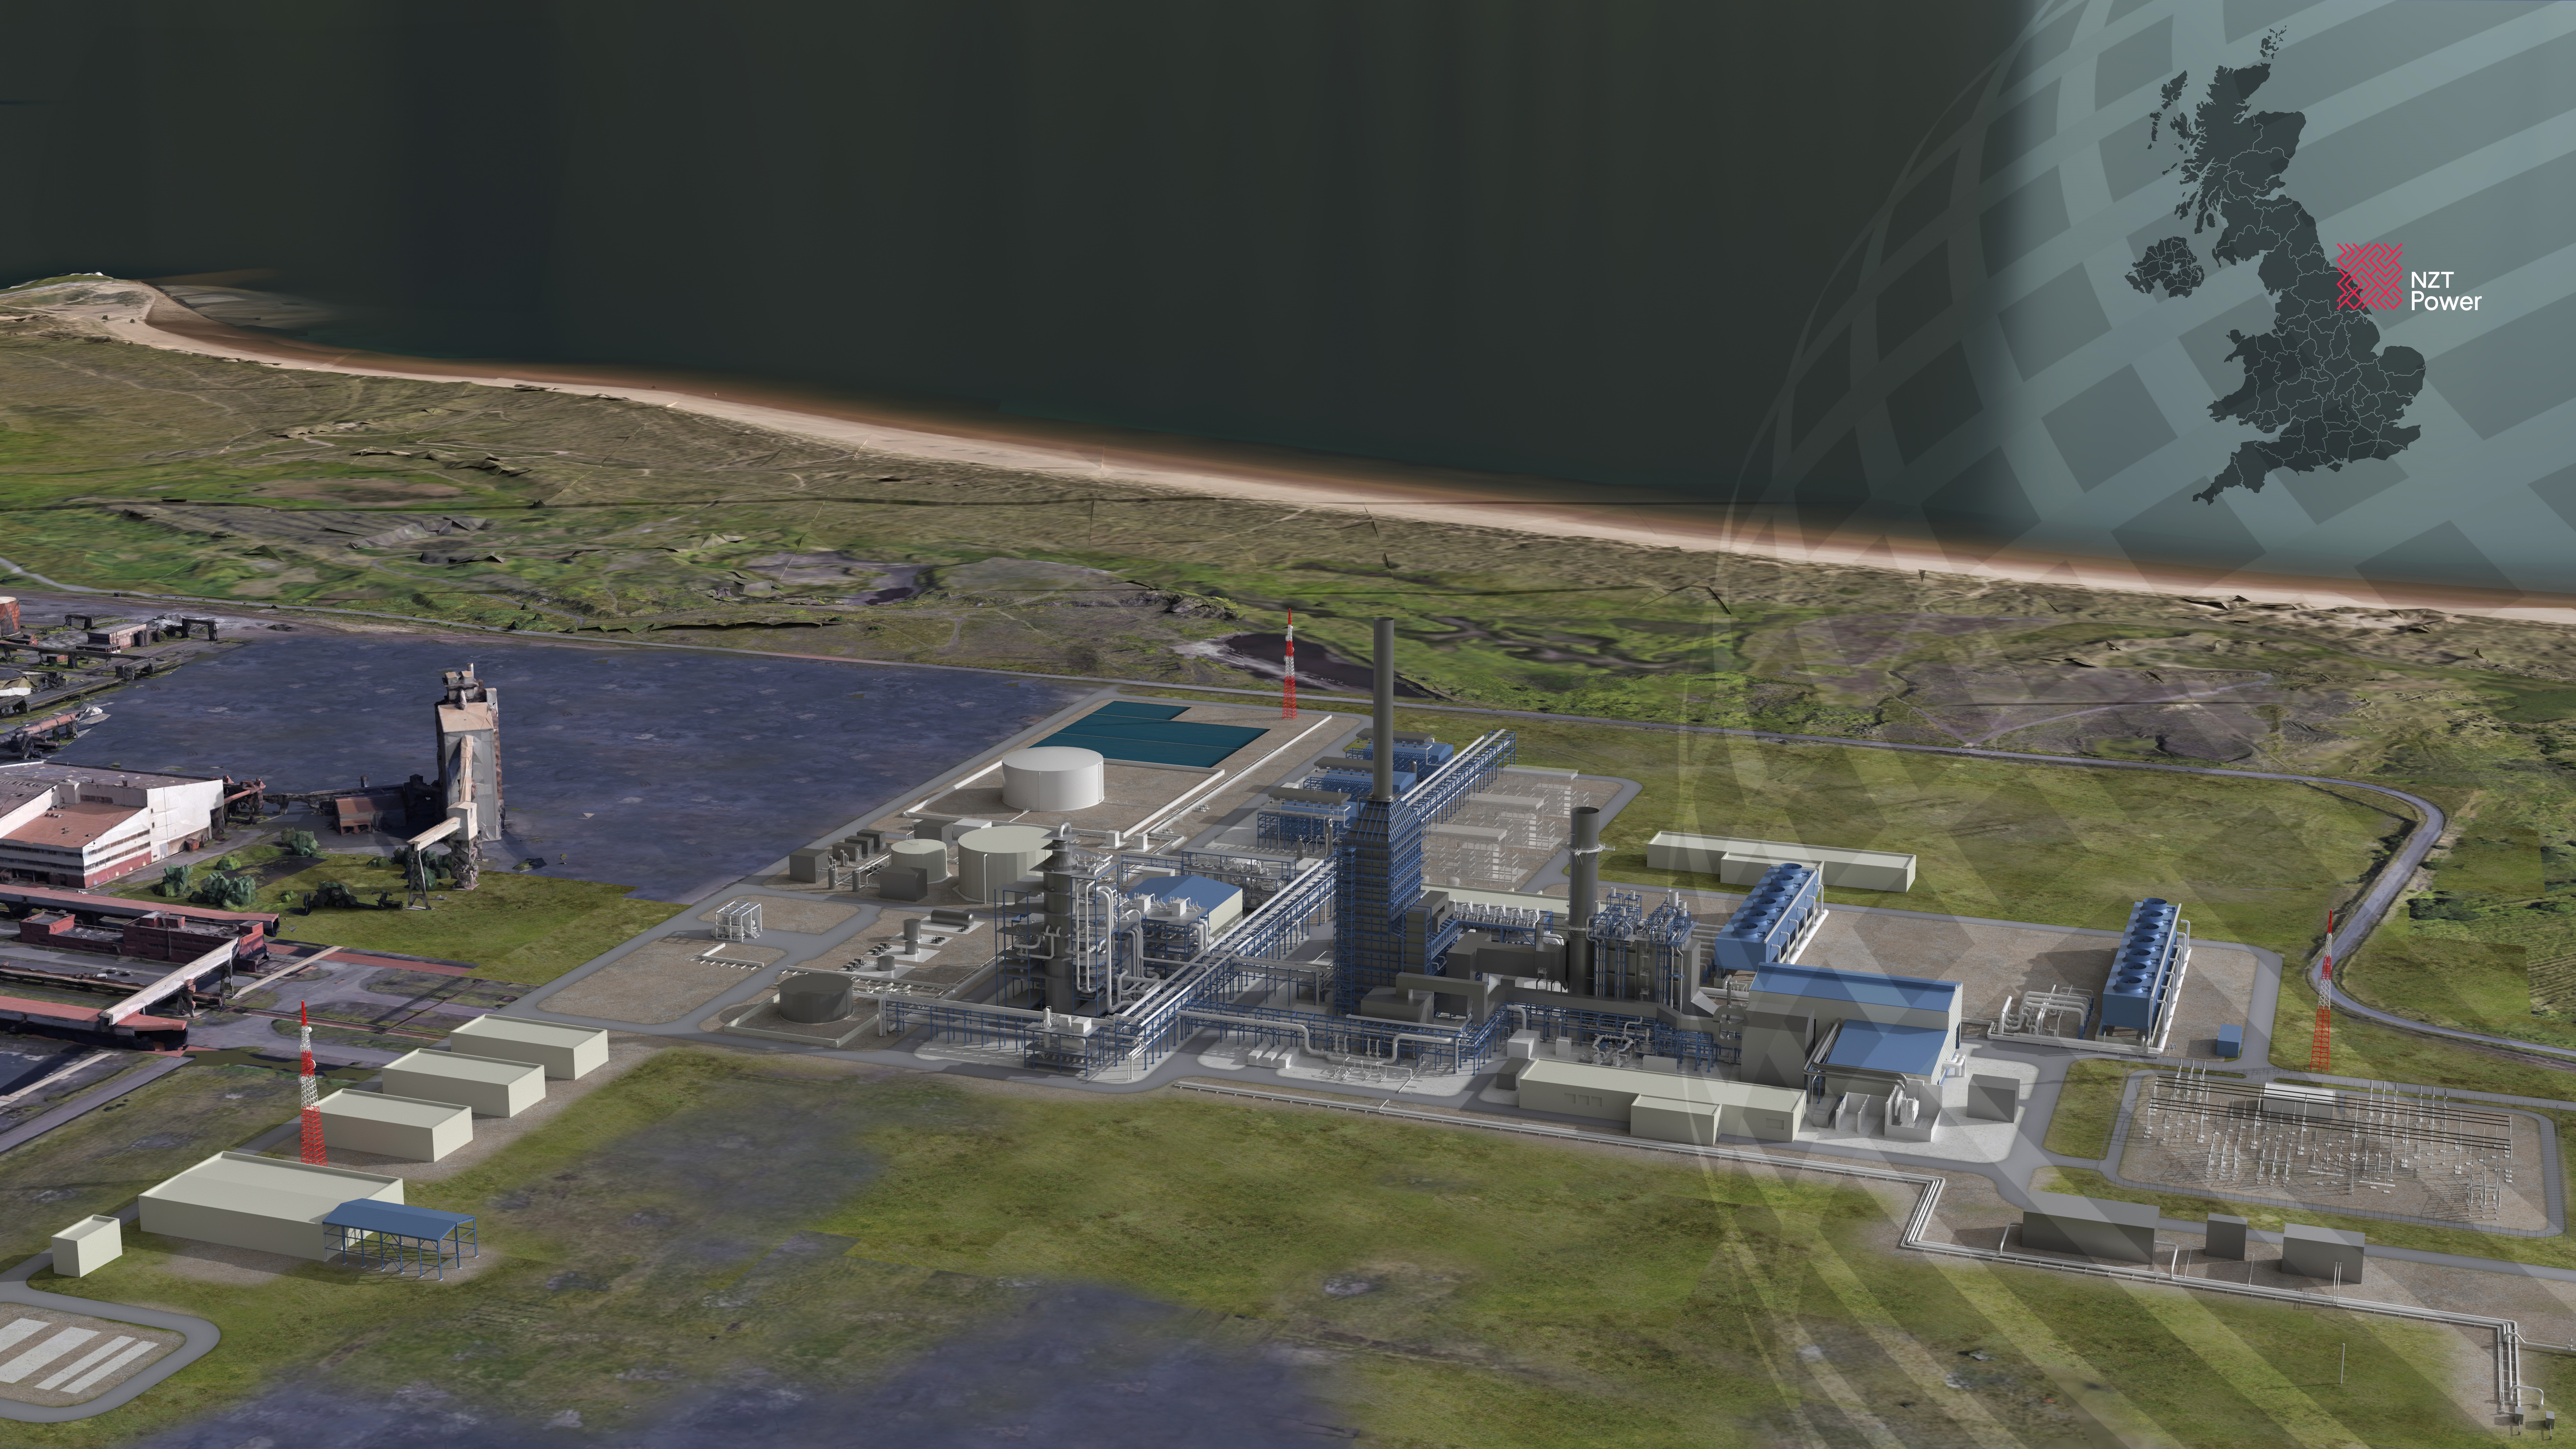
Teesside, the urban region perched on the muddy banks of the River Tees in northeast England, used to be a global beacon of industry. In the mid-19th century, the port of Middlesbrough forged its reputation as “Ironopolis,” boasting nearly 100 blast furnaces that roared away round the clock.
GE Vernova declares $0.25 per share quarterly dividend and initial $6 billion share buyback
NEW YORK (December 10, 2024) – GE Vernova (NYSE: GEV) today announced that its Board of Directors has declared a $0.25 per share quarterly dividend and approved an initial $6 billion share repurchase authorization. The quarterly dividend will be payable on January 28, 2025, to shareholders of record as of December 20, 2024.
Future dividend declarations will be made at the discretion of the Board of Directors and will be based on GE Vernova’s earnings, financial condition, cash requirements, prospects, and other factors. The share repurchase authorization has no expiration date and may be suspended or discontinued at any time.
Additional Information
GE Vernova’s website at www.gevernova.com/investors contains a significant amount of information about GE Vernova, including financial and other information for investors. GE Vernova encourages investors to visit this website from time to time, as information is updated, and new information is posted. Investors are also encouraged to visit GE Vernova’s LinkedIn and other social media accounts, which are platforms on which the Company posts information from time to time.
Additional Financial Information
Additional financial information can be found on the Company’s website at: www.gevernova.com/investors under Reports and Filings.
Caution concerning forward-looking statements
Certain statements contained in this release may constitute “forward-looking statements” that involve risks and uncertainties. These statements by their nature address matters that are uncertain to different degrees, such as statements regarding our possible future capital deployment, including share repurchase activity and dividends, if any. Forward-looking statements provide current expectations of future events based on certain assumptions and include any statement that does not directly relate to any historical or current fact. Words such as “anticipates,” “believes,” “expects,” “estimates,” “intends,” “plans,” “projects,” and similar expressions, may identify such forward-looking statements. Any forward-looking statement in this presentation speaks only as of the date on which it is made. Although we believe that the forward-looking statements contained in this presentation are based on reasonable assumptions, you should be aware that many factors could affect our actual financial results, cash flows, or results of operations and could cause actual results to differ materially from those in such forward-looking statements. Future dividends, if any, will be subject to factors noted in this release, and any share repurchases will be subject to similar factors as well as the price, availability and trading volumes of shares of the Company's common stock, which will affect the timing and size of any share repurchases. These factors may cause our actual future results to be materially different than those expressed in our forward-looking statements, and are more fully discussed in our most recent Quarterly Report on Form 10-Q filed with the Securities and Exchange Commission (SEC) and in the “Risk Factors” and “Management’s Discussion and Analysis of Financial Condition and Results of Operations” sections included in our Information Statement dated March 8, 2024, furnished with the SEC, and as may be updated from time to time in our SEC filings and as posted on our website at www.gevernova.com/investors/fls. There may be other factors not presently known to GE Vernova or which we currently consider to be immaterial that could cause our actual results to differ materially from those projected in any forward-looking statement that we make. We do not undertake any obligation to update or revise our forward-looking statements except as required by applicable law or regulation.
About GE Vernova
GE Vernova is a purpose-built global energy company that includes Power, Wind, and Electrification segments and is supported by its accelerator businesses. Building on over 130 years of experience tackling the world’s challenges, GE Vernova is uniquely positioned to help lead the energy transition by continuing to electrify the world while simultaneously working to decarbonize it. GE Vernova helps customers power economies and deliver electricity that is vital to health, safety, security, and improved quality of life. GE Vernova is headquartered in Cambridge, Massachusetts, U.S., with approximately 75,000 employees across 100+ countries around the world.
GE Vernova’s mission is embedded in its name – it retains its legacy, “GE,” as an enduring and hard-earned badge of quality and ingenuity. “Ver” / “verde” signal Earth’s verdant and lush ecosystems. “Nova,” from the Latin “novus,” nods to a new, innovative era of lower carbon energy. Supported by the Company purpose, The Energy to Change the World, GE Vernova will help deliver a more affordable, reliable, sustainable, and secure energy future. Learn more: GE Vernova’s website and LinkedIn.
end
© 2024 GE Vernova and/or its affiliates. All rights reserved.
GE and the GE Monogram are trademarks of General Electric Company used under trademark license.
Press Resources

Investor inquiries
Michael Lapides
GE Vernova | Vice President of Investor Relations
Media inquiries
Adam Tucker
GE Vernova | Director of Financial CommunicationsGE Vernova raises multi-year financial outlook, initiates dividend and authorizes buyback
-
Now anticipates ~$45B of revenue and 14% adjusted EBITDA margin* by 2028
-
Plans to invest ~$4B in capex and ~$5B in R&D through 2028 to fuel growth and innovation
-
Expects to generate at least $14B of cumulative free cash flow* from 2025 to 2028
-
Board of Directors declared a $0.25 per share quarterly dividend, payable in the first quarter of 2025, and approved an initial $6B share repurchase authorization
Strong financial trajectory from robust demand and better execution
NEW YORK (December 10, 2024) – GE Vernova (NYSE: GEV), a unique industry leader enabling customers to accelerate the energy transition, today hosts its 2024 Investor Update event to present its multi-year financial outlook and frame its capital allocation strategy.
“GE Vernova is well-positioned to lead as the investment supercycle for the energy transition gains momentum,” said GE Vernova CEO Scott Strazik. “Robust demand for our technologies and services, along with better execution through our lean culture, is driving improved financial results. We are driving growth and innovation with $9 billion in cumulative capex and R&D investments planned through 2028, including an approximately 20 percent increase in R&D spend expected in 2025. With growing revenue, margins, and free cash flow, we are building on our strong foundation and deploying a disciplined capital allocation strategy for shareholder value creation.”
“We are executing our financial strategy, and we now expect to generate at least $14 billion in cumulative free cash flow by 2028,” said GE Vernova CFO Ken Parks. “Our large and growing backlog, with healthy margins from services and better equipment pricing, is fueling our trajectory as we raise our 2025 guidance and outlook by 2028. We remain committed to maintaining an investment grade balance sheet as we make organic investments, pursue targeted M&A, and return at least one third of cash generation to shareholders through dividends and share repurchases.”
Financial Outlook
Today, GE Vernova reaffirms its 2024 revenue and free cash flow* guidance and narrows its 2024 adjusted EBITDA margin* guidance range. The company also raises its multi-year financial outlook, previously presented at its Investor Day in March 2024.
| Financial Metric | 2024 Guidance | 2025 Guidance | Outlook by 2028 |
| Revenue | $34-$35B, trending towards the higher end | $36-$37B, up from mid-single digits organic growth* (implied $35-$37B) | High-single digits-a) organic revenue growth*, up from mid-single digits |
| Adjusted EBITDA margin* | 5.5%-6%, narrowed from 5%-7% | High-single digits, up from the low end of high-single digits | 14%, up from 10% |
| Free cash flow* | $1.3-$1.7B, trending towards the higher end | $2.0-$2.5B, up from $1.2-$1.8B | ~100% conversion-b),up from 90-110% |
(a - Compound annual growth rate through 2028; 2025 is the base year
(b - Represents the expected free cash flow* conversion by 2028
Multi-Year Segment Financial Outlook
GE Vernova also reaffirms its 2024 segment guidance and provides additional multi-year guidance.
| Segment | 2024 Guidance | 2025 Guidance | Outlook by 2028 |
| Power |
|
|
|
| Wind |
|
|
|
| Electrification |
|
|
|
Capital Allocation
GE Vernova’s strategic principles for capital allocation include incremental organic investments to drive profitable growth, returning at least one third of cash generation to shareholders, and targeted, bolt-on mergers and acquisitions along with select next-generation technology investments. The GE Vernova Board of Directors has declared a $0.25 per share quarterly dividend, payable on January 28, 2025 to shareholders of record as of December 20, 2024, and approved an initial $6B share repurchase authorization.
Event Webcast
GE Vernova CEO Scott Strazik and CFO Ken Parks will present live from New York City, beginning at 4:30 PM ET today. The event will also be webcast, and accompanying materials and a replay can be accessed on GE Vernova’s Investor Relations website here.
Non-GAAP Financial Measures
In this document, the Company sometimes uses information derived from consolidated financial data but not presented in its financial statements prepared in accordance with U.S. generally accepted accounting principles (GAAP). Certain of these data are considered “non-GAAP financial measures” under the U.S. Securities and Exchange Commission (SEC) rules. These non-GAAP financial measures supplement the Company’s GAAP disclosures and should not be considered an alternative to the GAAP measure. The reasons the Company uses these non-GAAP financial measures and the reconciliations to their most directly comparable GAAP financial measures are included in this press release and GE Vernova's quarterly reports on Form 10-Q filed with the SEC and any updates or amendments it makes in future filings.
2024 Guidance and Outlook by 2028: Adjusted EBITDA margin*
We cannot provide a reconciliation of the differences between the non-GAAP financial measures expectations and the corresponding GAAP financial measures for adjusted EBITDA margin* in the 2024 guidance and outlook by 2028 without unreasonable effort due to the uncertainty of the costs and timing associated with potential restructuring actions and the impacts of depreciation and amortization.
2024 Guidance: Power segment organic EBITDA margin* expansion
We cannot provide a reconciliation of the differences between the non-GAAP financial measures expectations and the corresponding GAAP financial measure for Power segment organic EBITDA margin* expansion in the 2024 guidance without unreasonable effort due to the uncertainty of foreign exchange rates.
2024 and 2025 Guidance: Free cash flow*
We cannot provide a reconciliation of the differences between the non-GAAP financial measures expectations and the corresponding GAAP financial measure for free cash flow* in the 2024 and 2025 guidance without unreasonable effort due to the uncertainty of timing for capital expenditures.
2025-2028 Outlook: Cumulative Free cash flow*
We cannot provide a reconciliation of the differences between the non-GAAP financial measures expectations and the corresponding GAAP financial measure for cumulative free cash flow* for 2025 through 2028 without unreasonable effort due to the uncertainty of timing for capital expenditures.
*Non-GAAP Financial Measure
Caution concerning forward-looking statements
Certain statements contained in this release and certain of our other public communications and SEC filings may constitute “forward-looking statements” that involve risks and uncertainties. Forward-looking statements are based on our current assumptions regarding future business and financial performance and condition. These statements by their nature address matters that are uncertain to different degrees, such as our expected future business and operating results and opportunities; our progress as an independent company; the demand for our products and services, the roles we expect them to play in the energy transition and our ability to meet those demands and execute those roles; our business strategy and the benefits we expect to realize; our expected operational and safety efficiencies and improvements, including from our lean operating model; our expectations regarding the energy transition; our actual and planned investments, including in breakthrough technologies and capital expenditures; our ability to increase production capacity, efficiencies, and quality; the ability of us and others to innovate breakthrough technologies that enable us to meet our sustainability goals and targets; the ability of us and others to deploy such technologies at scale; our expected cash generation; our capital allocation strategies, including our future capital deployment, including mergers and acquisitions, share repurchase activity and dividends, if any, and long-term shareholder value creation; and our commitment to maintaining an investment grade rated balance sheet. Forward-looking statements provide current expectations of future events based on certain assumptions and include any statement that does not directly relate to any historical or current fact. Words such as “anticipates,” “believes,” “expects,” “estimates,” “intends,” “plans,” “projects,” and similar expressions, may identify such forward-looking statements. Any forward-looking statement in this release speaks only as of the date on which it is made. Although we believe that the forward-looking statements contained in this release are based on reasonable assumptions, you should be aware that many factors could affect our actual financial results, cash flows, or results of operations and could cause actual results to differ materially from those in such forward-looking statements, including but not limited to:
- Changes in macroeconomic and market conditions and market volatility, including risk of recession, inflation, supply chain constraints or disruptions, interest rates, the value of securities and other financial assets, oil, natural gas and other commodity prices and exchange rates, and the impact of such changes and volatility on the Company’s business operations, financial results and financial position;
- Global economic trends, competition and geopolitical risks, including impacts from the ongoing geopolitical conflicts (such as the Russia-Ukraine conflict and conflict in the Middle East), demand or supply shocks from events such as a major terrorist attack, natural disasters, actual or threatened public health pandemics or other emergencies, or an escalation of sanctions, tariffs or other trade tensions, and related impacts on our supply chains and strategies;
- Actual or perceived quality issues or product or safety failures related to our complex and specialized products, solutions, and services, the time required to address them, costs associated with related project delays, repairs or replacements, and the impact of any contractual claims for damages or other legal claims asserted in connection therewith, some of which may be for significant amounts, on our financial results, competitive position or reputation;
- Market developments or customer actions that may affect our ability to achieve our anticipated operational cost savings and implement initiatives to control or reduce operating costs;
- Significant disruptions in the Company’s supply chain, including the high cost or unavailability of raw materials, components, and products essential to our business, and significant disruptions to our manufacturing and production facilities and distribution networks;
- Our ability to attract and retain highly qualified personnel;
- Our ability to obtain, maintain, protect and effectively enforce our intellectual property rights;
- Our capital allocation plans, including the timing and amount of any dividends, share repurchases, acquisitions, organic investments, and other priorities;
- Downgrades of our credit ratings or ratings outlooks, or changes in rating application or methodology, and the related impact on the Company’s funding profile, costs, liquidity and competitive position;
- Shifts in market and other dynamics related to electrification, decarbonization or sustainability;
- The amount and timing of our cash flows and earnings, which may be impacted by macroeconomic, customer, supplier, competitive, contractual and other dynamics and conditions;
- Actions by our joint venture arrangements, consortiums, and similar collaborations with third parties for certain projects that result in additional costs and obligations;
- Any reductions or modifications to, or the elimination of, governmental incentives or policies that support renewable energy and energy transition innovation and technology;
- Our ability to develop and introduce new technologies to meet market demand and evolving customer needs;
- Our ability to obtain required permits, licenses and registrations;
- Changes in law, regulation or policy that may affect our businesses, such as trade policy and tariffs, regulation and incentives related to sustainability, climate change, environmental, health and safety laws, and tax law changes;
- Our ability and challenges to manage the transition as a newly stand-alone public company or achieve some or all of the benefits we expect to achieve from such transition;
- The risk of an active trading market not being sustained for our securities or significant volatility in our stock price; and
- The impact related to information technology, cybersecurity or data security breaches at GE Vernova or third parties.
These or other uncertainties may cause our actual future results to be materially different than those expressed in our forward-looking statements, and these and other factors are more fully discussed in our Quarterly Report on Form 10-Q for the quarter ended September 30, 2024, and in the “Risk Factors” and “Management’s Discussion and Analysis of Financial Condition and Results of Operations” sections included in our information statement dated March 8, 2024, which was attached as Exhibit 99.1 to a Current Report on Form 8-K furnished with the Securities and Exchange Commission (SEC) on March 8, 2024 as may be updated from time to time in our SEC filings and as posted on our website at www.gevernova.com/investors/fls. There may be other factors not presently known to GE Vernova or which we currently consider to be immaterial that could cause our actual results to differ materially from those projected in any forward-looking statement that we make. We do not undertake any obligation to update or revise our forward-looking statements except as required by applicable law or regulation. This press release also includes certain forward-looking projected financial information that is based on current estimates and forecasts. Actual results could differ materially.
Additional Information
GE Vernova’s website at www.gevernova.com/investors contains a significant amount of information about GE Vernova, including financial and other information for investors. GE Vernova encourages investors to visit this website from time to time, as information is updated, and new information is posted. Investors are also encouraged to visit GE Vernova’s LinkedIn and other social media accounts, which are platforms on which the Company posts information from time to time.
Additional Financial Information
Additional financial information can be found on the Company’s website at: www.gevernova.com/investors under Reports and Filings.
About GE Vernova
GE Vernova is a purpose-built global energy company that includes Power, Wind, and Electrification segments and is supported by its accelerator businesses. Building on over 130 years of experience tackling the world’s challenges, GE Vernova is uniquely positioned to help lead the energy transition by continuing to electrify the world while simultaneously working to decarbonize it. GE Vernova helps customers power economies and deliver electricity that is vital to health, safety, security, and improved quality of life. GE Vernova is headquartered in Cambridge, Massachusetts, U.S., with approximately 75,000 employees across 100+ countries around the world.
GE Vernova’s mission is embedded in its name – it retains its legacy, “GE,” as an enduring and hard-earned badge of quality and ingenuity. “Ver” / “verde” signal Earth’s verdant and lush ecosystems. “Nova,” from the Latin “novus,” nods to a new, innovative era of lower carbon energy. Supported by the Company purpose, The Energy to Change the World, GE Vernova will help deliver a more affordable, reliable, sustainable, and secure energy future. Learn more: GE Vernova’s website and LinkedIn.
end
© 2024 GE Vernova and/or its affiliates. All rights reserved.
GE and the GE Monogram are trademarks of General Electric Company used under trademark license.
Press Resources

Investor inquiries
Michael Lapides
GE Vernova | Vice President of Investor Relations