
The world’s demand for energy is growing at a pace that’s increasingly difficult to match — and two years into its journey as a standalone company, GE Vernova is meeting the challenge head-on. The company is helping energy customers find reliable, cost-effective solutions for today that can be quickly scaled to meet the needs of tomorrow. Here are just a few of them.
Electrifying the Future of Data Centers and AI
Related News
GE Vernova to announce first quarter 2026 financial results on April 22
CAMBRIDGE, Mass. (April 7, 2026) – GE Vernova Inc. (NYSE: GEV) is scheduled to release its first quarter 2026 financial results on Wednesday, April 22, 2026, before market open. GE Vernova CEO Scott Strazik and CFO Ken Parks will discuss the company’s financial results in a webcast at 7:30 AM ET, which can be accessed at https://www.gevernova.com/investors/events.
The earnings press release and supplementary financial information, including reconciliations of non-GAAP financial measures, will also be posted at the same link on the GE Vernova Investor Relations website. A replay of the call will be made available as a direct download on GE Vernova’s website at www.gevernova.com/investors/events.
Additional Information
GE Vernova’s website at www.gevernova.com/investors contains a significant amount of information about GE Vernova, including financial and other information for investors. GE Vernova encourages investors to visit this website from time to time, as information is updated, and new information is posted. Investors are also encouraged to visit GE Vernova’s LinkedIn and other social media accounts, which are platforms on which the company posts information from time to time.
end
About GE Vernova
GE Vernova Inc. (NYSE: GEV) is a purpose-built global energy company that includes Power, Electrification and Wind segments and is supported by its accelerator businesses. Building on over 130 years of experience tackling the world’s challenges, GE Vernova is uniquely positioned to help lead the energy transition by continuing to electrify the world while simultaneously working to decarbonize it. GE Vernova helps customers power economies and deliver electricity that is vital to health, safety, security, and improved quality of life. GE Vernova is headquartered in Cambridge, Massachusetts, U.S., with approximately 85,000 employees across approximately 100 countries around the world. Supported by the Company’s purpose, The Energy to Change the World, GE Vernova technology helps deliver a more affordable, reliable, sustainable, and secure energy future.
© 2026 GE Vernova and/or its affiliates. All rights reserved.
GE and the GE Monogram are trademarks of General Electric Company used under trademark license.

Investor inquiries
Michael Lapides
GE Vernova | Vice President of Investor Relations
Media inquiries
Adam Tucker
GE Vernova | Director of Financial CommunicationsHow Storms, War, and Surging Demand Are Forcing a Rethink of the World’s Power Grids
In the early hours of October 25, 2023, residents of Acapulco watched Hurricane Otis gather strength offshore. Forecasts had suggested a manageable storm. Instead, within less than 12 hours, Otis intensified from a Category 1 to a Category 5, with gusts exceeding 165 miles per hour.
In Vietnam, Sustainable Energy Is Going from Big Idea to Revolutionary Reality

How does one of the world’s fastest-growing economies keep the lights on while rewiring its future to meet the needs and goals of a net-zero world? This is the question being asked today in Vietnam, a nation at an exciting crossroads, balancing rapid economic growth with the imperative to build a cleaner, more resilient energy system.
Related News
GE Vernova Foundation, ASSIST Asia and Electric Power University open learning labs to train next generation energy workforce
HANOI, Vietnam (11 March, 2026) – Today in Hanoi the GE Vernova Foundation and partners ASSIST Asia and Electric Power University (EPU) cut the ribbon at the new Centers of Excellence on Wind Energy at EPU. The new center is funded by the GE Vernova Foundation’s RENEW Skills Development grant program, which over the past year has developed new, industry-aligned courses and outfitted five learning labs across the country, officially beginning the education and training of learners for high-demand technical careers.
Five learning labs, including two Centers of Excellence, have been established with educational partners and equipped with modern renewable energy technologies training equipment which will serve as hubs for course development, teacher capacity building and student training. The program anticipates reaching over 4,000 students and technical workers by 2027.
“The world needs energy, and to meet that demand we must accelerate the training and development of the next generation of energy leaders,” said Kristin Carvell, President, GE Vernova Foundation and Chief Communications Officer, GE Vernova. “With today’s ribbon cutting, we are doing just that here in Vietnam and advancing our broader goal of training 30,000 students and learners globally by 2030.”
“The establishment of the Center of Excellence on Wind Energy reflects our commitment to delivering industry-aligned, practice-oriented education,” said Assoc. Prof. Dr. Đinh Văn Châu, President of Electric Power University. “Through this partnership with GE Vernova Foundation and ASSIST, we are strengthening our capacity to equip students with the skills needed to support Vietnam’s energy transition.
At ASSIST, our mission is to drive social improvement and sustainable transformation through capacity development,” said Aru David, Regional Director of ASSIST Asia. “Through RENEW Skills, we are partnering with universities and colleges to empower students and technical workers with practical competencies in renewable energy, strengthening resilience and supporting Vietnam’s transition toward a more sustainable and inclusive energy future.”
“Skilled workforce development is a core focus of the GE Vernova Foundation, and this lab at EPU brings that commitment to life in Vietnam. Technical skills are the foundation of a strong energy workforce — and through RENEW Skills, we aim to create well-paying career opportunities for economically disadvantaged communities, while building the talent Vietnam needs for its energy transition," said Ramesh Singaram, Board Director, GE Vernova Foundation and President & CEO, Gas Power Asia, GE Vernova.
The RENEW Skills Development Program was launched with a $750,000 grant by the GE Vernova Foundation in November 2024, and is administered locally by ASSIST Asia. The program focuses on both the current workforce and the future generations of university and technical vocational college students, by providing access to new curricula and practical training focused on wind energy project design, operations and maintenance, grid integration, and workplace safety.
As Vietnam works to meet its 2050 Net Zero commitment, skilled workers and technicians will play a vital role in building a sustainable energy future. And because of that, and in alignment with the Just Energy Transition Partnership agreement announced in 2022, it is important to invest in new training and educational programs and drive awareness of these critical careers as Vietnam implements its Resource Mobilization Plan.
GE Vernova has a long history and strong presence in Vietnam, and just yesterday hosted an exclusive ‘Energy of Change’ Summit in Hanoi. The Summit convened over 400 distinguished senior representatives from government, national utilities, suppliers, and industry partners from across the energy ecosystem of Vietnam and Asia to advance Vietnam’s energy transition as it moves from planning into large-scale implementation under the Revised Power Development Plan VIII (PDP8R).
GE Vernova has over 1,100 employees in Vietnam who work closely with our customers locally and globally to support the country’s economy. With a robust footprint comprised of manufacturing facilities, repair and service centers, nearly 30% of Vietnam’s electricity needs are met through GE Vernova’s equipment and installed solutions today.
###
About the GE Vernova Foundation
The GE Vernova Foundation, an independent charitable organization funded by GE Vernova, puts the company’s purpose – The Energy to Change the World – into practice across the global communities where employees live and work. Building on the 100+ year legacy of the GE Foundation, the new GE Vernova Foundation is prioritizing employees through programs such as Matching Gifts and STAR Awards. The Foundation’s resources are channeled into initiatives focused on championing the global workforce needed for the energy transition as well as building stronger and more resilient communities. Learn more at www.gevernova.com/about/philanthropy.
About Asia Society for Social Improvement and Sustainable Transformation (ASSIST Asia)
ASSIST Asia is a Pan-Asian non-profit organization founded & operating since 2003 across several Asian countries. We specialize in capacity development initiatives in our key focus areas such as Education & Skills, Health, Agriculture & rural development and Green Economy. ASSIST Vietnam has been implementing social improvement & sustainable transformation projects in Vietnam since 2007. Its goal is to empower its target groups to make them resilient to the social, economic and environmental challenges. To learn more about ASSIST, visit www.assistasia.org.
About Electric Power University (EPU)
EPU is a public university with a multi-level and multi-discipline system, operating under the management of Vietnam Ministry of Industry and Trade (MoIT) and its main function is to provide high quality manpower at different training levels for the power sector to satisfy society’s needs. It is also one of the leading research centers for science and technology within the sector. Apart from retraining and advanced training for technical and management staff members of the power sector, the university also develops and promotes scientific research, international cooperation, transfer and deployment of new technology applications.
Guided by the philosophy of "comprehensive education, strong foundations, and sustainable future," and with the aim of becoming a leading applied university in Vietnam, we have established a comprehensive and autonomous model that integrates international education standards. Our numerous research outcomes have effectively met practical needs and contributed to the industrialization and modernization of our country; aligning with the core values of EPU, which are "Responsibility, Creativity, and Efficiency."
For further information about Electric Power University, please visitvhttps://epu.edu.vn/.
end
About GE Vernova
GE Vernova Inc. (NYSE: GEV) is a purpose-built global energy company that includes Power, Electrification and Wind segments and is supported by its accelerator businesses. Building on over 130 years of experience tackling the world’s challenges, GE Vernova is uniquely positioned to help lead the energy transition by continuing to electrify the world while simultaneously working to decarbonize it. GE Vernova helps customers power economies and deliver electricity that is vital to health, safety, security, and improved quality of life. GE Vernova is headquartered in Cambridge, Massachusetts, U.S., with approximately 85,000 employees across approximately 100 countries around the world. Supported by the Company’s purpose, The Energy to Change the World, GE Vernova technology helps deliver a more affordable, reliable, sustainable, and secure energy future.
© 2026 GE Vernova and/or its affiliates. All rights reserved.
GE and the GE Monogram are trademarks of General Electric Company used under trademark license.
Press Resources

GE Vernova Foundation, ASSIST Asia, and Electric Power University open learning labs to train next generation energy workforce.
Image credit: GE Vernova

GE Vernova Foundation, ASSIST Asia, and Electric Power University open learning labs to train next generation energy workforce.
Image credit: GE Vernova
Media inquiries
GE Vernova powers Vietnam’s energy transition with key regional commitments at inaugural Energy of Change Summit
-
GE Vernova’s Energy of Change Summit convenes 400 senior leaders from government, industry, and the energy ecosystem across Vietnam and Asia, marking the first thought leadership platform of its kind.
-
GE Vernova marks the start of commercial operation of PetroVietnam Power Corporation’s (PV Power) Nhon Trach 3&4 1.6-gigawatt (GW) Power Plant.
-
GE Vernova’s 9HA.02 gas turbines and H78 generators have been chosen for three strategic LNG power projects— PV Power’s LNG Power Plant, Hai Phong LNG Power Plant (VinEnergo), and Quang Trach II LNG Power Plant (EVN)—totaling six HA gas turbines and six H78 generators.
-
GE Vernova announces approximately $200 million investment in a new HVDC manufacturing facility in Hai Phong to support Asia’s fast‑growing energy demand.
-
GE Vernova and Vietnam Electricity (EVN) sign an MoU to explore potential opportunities in HVDC technology.
HANOI, Vietnam (March 10, 2026) – GE Vernova Inc. (NYSE: GEV) today hosted the inaugural Energy of Change Summit in Hanoi, bringing together over 400 senior representatives from government, national utilities, suppliers, and energy ecosystem stakeholders across Vietnam and Asia. Hosted by Scott Strazik, President and CEO, GE Vernova, and attended by Acting Minister of Industry and Trade, Lê Mạnh Hùng, the summit focused on advancing Vietnam’s energy transition as the country moves from planning into large-scale implementation under the Revised Power Development Plan VIII (PDP8R).
Additionally, GE Vernova’s Supplier Summit, attended by more than 100 supplier organizations, was held alongside the main event, with a focus on building a resilient regional energy supply chain, advancing Vietnam's economic goals, and creating shared value through strategic partnerships.
Centered on the theme 'Powering Vietnam: From Concept to Reality', the summit examined Vietnam's power sector as an integral part of Asia's broader energy future. Discussions covered the next phase of PDP8R execution — from strengthening local capability and deepening supply chain integration to enhancing system flexibility for a more diversified energy mix — alongside the latest advances in generation and transmission technologies and best practices from leading markets worldwide.
In his keynote, Acting Minister of Industry and Trade, Lê Mạnh Hùng underscored Vietnam's commitment to accelerating its energy transition, emphasizing the need to meet rapidly growing energy demand while ensuring long‑term, sustainable economic growth.
"Vietnam has emerged as one of Asia's fastest‑growing economies, with a power system undergoing rapid and ambitious transformation," said Scott Strazik, President and CEO of GE Vernova. "As the country enters a decisive execution phase, GE Vernova is proud to stand alongside Vietnam in this journey. From supplying our HA technology for Nhon Trach 3 & 4, the country's first LNG‑to‑power plants — to establishing our HVDC manufacturing presence for the region's growing electrification needs, what we build here extends far beyond Vietnam's borders. These investments strengthen supply chains, build local skills and industrial capability, and lay the foundation to power economies across Asia and beyond."
New initiatives and milestones announced at the event included the following:
Commissioning of Nhon Trach 3&4 power plants: GE Vernova marked the start of commercial operation of PetroVietnam Power Corporation (PV Power)’s Nhon Trach 3&4 1.6-gigawatt (GW) Power Plant. This is the first HA-powered plant in Vietnam and the first to be powered by liquefied natural gas (LNG). Powered by 9HA.02 technology, the power plant can deliver 1.6 gigawatt of electricity to the grid. The power plant is expected to improve the reliability and stability of the energy grid to support renewables penetration.
Building on the success of the Nhon Trach 3 & 4 project, GE Vernova announced the selection of its technology for three additional strategic LNG power projects.
- Powering PV Power’s LNG Power Plant in Vietnam: GE Vernova has been selected by PV Power to supply 9HA.02 gas turbines and H78 generators. Under the agreement signed on March 10, 2026, two gas turbine and generator units will be prioritized for delivery in 2029 for the Quynh Lap LNG power project, which will have an installed capacity of approximately 1.6 gigawatts. The supply of additional units will be discussed by both parties in the near future. This agreement marks a significant milestone in the collaboration between GE Vernova and PV Power. The Quynh Lap project—is one of PV Power’s priority projects for development and operation during the 2025–2030 period.
- Powering the VinEnergo Hai Phong LNG‑fired Power Plant: GE Vernova has been selected by the Vingroup–VinEnergo joint venture to supply two 9HA.02 gas turbines and two H78 generators, delivering more than 1.6 gigawatts (GW) of power. The project is expected to reduce reliance on traditional fossil fuels, enhance national energy security, and improve power grid stability, marking a strategic step by Vingroup toward more sustainable growth. In addition to strengthening electricity supply for Hai Phong and the national grid, the plant is anticipated to catalyze high‑tech industrial development in line with more sustainable growth trends.
- Powering Quang Trach II LNG Power Plant: GE Vernova technology has been approved to provide over 1.6 gigawatts (GW) of power by Vietnam Electricity(EVN) for their Quang Trach II LNG power plant in Quang Tri Province, Vietnam. For the new gas‑fired facility, GE Vernova is expected to supply two 9HA.02 gas turbines and two H78 generators. The plant is targeted to be fully operational by 2030. Originally, Quang Trach II was designed as a coal‑fired power plant with a capacity of 1.2 GW. The conversion of the Quang Trach II Thermal Power Plant from coal to LNG has been approved by the Government in accordance with Vietnam’s National Energy Development Strategy through 2030. This project marks a significant expansion of gas‑fired power generation and accelerates the country’s transition from coal to gas.
- Plans to invest in a Grid Solutions manufacturing site in Vietnam: GE Vernova announced that it is investing approximately USD 200 million* to expand manufacturing capacity with a new facility in Hai Phong, Vietnam, supporting the infrastructure required to meet growing global electrification needs as electricity demand continues to rise. The new facility will manufacture large power transformers mainly for High-Voltage Direct Current (HVDC) projects, complementing GE Vernova’s existing HVDC transformer manufacturing facilities in Stafford, UK, and India. These technologies are used to move electricity efficiently over long distances and ensure power networks can safely and reliably handle rising electricity demand. The Hai Phong facility will be developed in phases, with full operations expected in 2028, subject to regulatory approvals. Once operational, the site is expected to manufacture critical power equipment at scale, supporting GE Vernova’s global project pipeline, with a primary focus on meeting growing regional demand.
- MoU to explore potential opportunities in HVDC technology: GE Vernova and Vietnam Electricity (EVN) signed a non-binding Memorandum of Understanding (MoU) to explore potential collaboration areas and opportunities in relation to HVDC technology, in line with Vietnam’s PDP8R. Through this MoU, both organizations plan to explore how HVDC solutions — which enable the efficient transmission of large volumes of electricity over long distances — could support the continued development of Vietnam’s transmission infrastructure.
GE Vernova’s equipment provides up to 30% of the Vietnam’s electricity needs, with over 1,100 employees across 9 locations from various GE Vernova businesses throughout the country. GE Vernova’s global customers are served by a global network of repair and manufacturing capabilities which include GE Vernova’s Phu My repair facility and Dung Quat HRSG manufacturing plant in Vietnam.
Note to editors:
* These investments are part of GE Vernova’s $11 billion cumulative global capex and R&D investment plan from 2025 through 2028.
Technology selection does not constitute a firm order or backlog for GE Vernova and is subject to execution of definitive agreements.
end
About GE Vernova
GE Vernova Inc. (NYSE: GEV) is a purpose-built global energy company that includes Power, Electrification and Wind segments and is supported by its accelerator businesses. Building on over 130 years of experience tackling the world’s challenges, GE Vernova is uniquely positioned to help lead the energy transition by continuing to electrify the world while simultaneously working to decarbonize it. GE Vernova helps customers power economies and deliver electricity that is vital to health, safety, security, and improved quality of life. GE Vernova is headquartered in Cambridge, Massachusetts, U.S., with approximately 85,000 employees across approximately 100 countries around the world. Supported by the Company’s purpose, The Energy to Change the World, GE Vernova technology helps deliver a more affordable, reliable, sustainable, and secure energy future.
Forward-Looking Statements
This document contains forward-looking statements – that is, statements related to future events that by their nature address matters that are, to different degrees, uncertain. These forward-looking statements often address GE Vernova’s expected future business and financial performance and financial condition, and the expected performance of its products, the impact of its services and the results they may generate or produce, and often contain words such as “expect,” “anticipate,” “intend,” “plan,” “believe,” “seek,” “see,” “will,” “would,” “estimate,” “forecast,” “target,” “preliminary,” or “range.” Forward-looking statements by their nature address matters that are, to different degrees, uncertain, such as statements about planned and potential transactions, investments or projects and their expected results and the impacts of macroeconomic and market conditions and volatility on the Company’s business operations, financial results and financial position and on the global supply chain and world economy.
© 2026 GE Vernova and/or its affiliates. All rights reserved.
GE and the GE Monogram are trademarks of General Electric Company used under trademark license.
Press Resources

Caption - Scott Strazik, President and CEO of GE Vernova, with Philippe Piron, CEO of GE Vernova’s Electrification segment, at the Energy of Change Summit in Vietnam.
Image credit: GE Vernova
Media inquiries
GE Vernova CEO Scott Strazik to speak at Bank of America Global Industrials Conference 2026
CAMBRIDGE, Mass. (March 4, 2026) – GE Vernova Inc. (NYSE: GEV) Chief Executive Officer and President Scott Strazik will present at the Bank of America Global Industrials Conference 2026 on Wednesday, March 18, 2026, at 8:50 AM GMT (4:50 AM EST). Strazik will speak to investors in a fireside chat, highlighting how GE Vernova’s platform of solutions is well-positioned to serve the growing, long-cycle electric power market.
The conference webcast and replay will be available through GE Vernova’s Investor Relations website at https://www.gevernova.com/investors/events.
Additional information
GE Vernova’s website at https://www.gevernova.com/investors contains a significant amount of information about GE Vernova, including financial and other information for investors. GE Vernova encourages investors to visit this website from time to time as information is updated and new information is posted. Investors are also encouraged to visit GE Vernova’s LinkedIn and other social media accounts, which are platforms on which the company posts information from time to time.
end
About GE Vernova
GE Vernova Inc. (NYSE: GEV) is a purpose-built global energy company that includes Power, Electrification and Wind segments and is supported by its accelerator businesses. Building on over 130 years of experience tackling the world’s challenges, GE Vernova is uniquely positioned to help lead the energy transition by continuing to electrify the world while simultaneously working to decarbonize it. GE Vernova helps customers power economies and deliver electricity that is vital to health, safety, security, and improved quality of life. GE Vernova is headquartered in Cambridge, Massachusetts, U.S., with approximately 85,000 employees across approximately 100 countries around the world. Supported by the Company’s purpose, The Energy to Change the World, GE Vernova technology helps deliver a more affordable, reliable, sustainable, and secure energy future.
© 2026 GE Vernova and/or its affiliates. All rights reserved.
GE and the GE Monogram are trademarks of General Electric Company used under trademark license.
Investor inquiries
Michael Lapides
GE Vernova | Vice President of Investor Relations
Media inquiries
Adam Tucker
GE Vernova | Director of Financial CommunicationsGE Vernova completes sale of Proficy® software business to TPG
CAMBRIDGE, Mass. (March 2, 2026) – GE Vernova Inc. (NYSE: GEV) announced today the completion of the previously announced acquisition of GE Vernova's Proficy® software business ("Proficy") by TPG, a leading global alternative asset management firm, for $600 million.
The transaction establishes Proficy as an independent software business serving more than 20,000 customers across discrete, process, and hybrid manufacturing, as well as metro transit and other infrastructure applications. Proficy's fully integrated solutions include cloud-based and on-premises HMI/SCADA, MES, industrial data management, and analytics, offering architectural flexibility from equipment to the production line, plant, and full enterprise.
With the close of this transaction, TPG now owns and controls the Proficy business. GE Vernova remains focused on delivering its software solutions that help customers electrify and decarbonize the energy ecosystem, anchored by GridOS®, its enterprise software and AI platform for grid orchestration.
Forward-Looking Statements
This press release contains forward-looking statements – that is, statements related to future events that by their nature address matters that are, to different degrees, uncertain. Forward-looking statements may be identified by words such as "expect," "anticipate," "intend," "plan," "will," "would," "estimate," "believe," "project," "outlook," and similar expressions. Such statements, including those regarding the expected future business operations of GE Vernova and the standalone Proficy software business, are subject to risks and uncertainties that could cause actual results to differ materially. These risks include factors described in GE Vernova's filings with the Securities and Exchange Commission, including its most recent Annual Report on Form 10-K and subsequent SEC filings. GE Vernova undertakes no obligation to update any forward-looking statements except as required by law.
end
About GE Vernova
GE Vernova Inc. (NYSE: GEV) is a purpose-built global energy company that includes Power, Electrification and Wind segments and is supported by its accelerator businesses. Building on over 130 years of experience tackling the world’s challenges, GE Vernova is uniquely positioned to help lead the energy transition by continuing to electrify the world while simultaneously working to decarbonize it. GE Vernova helps customers power economies and deliver electricity that is vital to health, safety, security, and improved quality of life. GE Vernova is headquartered in Cambridge, Massachusetts, U.S., with approximately 85,000 employees across approximately 100 countries around the world. Supported by the Company’s purpose, The Energy to Change the World, GE Vernova technology helps deliver a more affordable, reliable, sustainable, and secure energy future.
© 2026 GE Vernova and/or its affiliates. All rights reserved.
GE and the GE Monogram are trademarks of General Electric Company used under trademark license.
Investor inquiries
Michael Lapides
GE Vernova | Vice President of Investor Relations
Media inquiries
Adam Tucker
GE Vernova | Director of Financial CommunicationsGE Vernova declares second quarter 2026 dividend
CAMBRIDGE, Mass. (February 17, 2026) – GE Vernova (NYSE: GEV) today announced that its Board of Directors has declared a $0.50 per share quarterly dividend. The quarterly dividend will be payable on April 14, 2026, to shareholders of record as of March 17, 2026.
Future dividend declarations will be made at the discretion of the Board of Directors and will be based on GE Vernova’s earnings, financial condition, cash requirements, prospects, and other factors.
Additional Information
GE Vernova’s website at www.gevernova.com/investors contains a significant amount of information about GE Vernova, including financial and other information for investors. GE Vernova encourages investors to visit this website from time to time, as information is updated, and new information is posted. Investors are also encouraged to visit GE Vernova’s LinkedIn and other social media accounts, which are platforms on which the Company posts information from time to time.
Additional Financial Information
Additional financial information can be found on the Company’s website at www.gevernova.com/investors under Reports and Filings.
Forward-Looking Statements
This document contains forward-looking statements – that is, statements related to future events that by their nature address matters that are, to different degrees, uncertain, such as statements about possible future dividend declarations and payments. Forward-looking statements are subject to risks, uncertainties, and other factors, which could cause actual results to differ materially from current expectations. These risks, uncertainties, and factors include those discussed in our most recent Annual Report on Form 10-K and in our subsequently filed Quarterly Reports on Form 10-Q, including in the "Risk Factors" and "Management's Discussion and Analysis of Financial Condition and Results of Operation" sections included therein, as may be updated from time to time in our filings with the U.S. Securities and Exchange Commission and as posted on our website at www.gevernova.com/investors/fls. GE Vernova does not undertake any obligation to update or revise its forward-looking statements except as required by law or regulation.
end
About GE Vernova
GE Vernova Inc. (NYSE: GEV) is a purpose-built global energy company that includes Power, Electrification and Wind segments and is supported by its accelerator businesses. Building on over 130 years of experience tackling the world’s challenges, GE Vernova is uniquely positioned to help lead the energy transition by continuing to electrify the world while simultaneously working to decarbonize it. GE Vernova helps customers power economies and deliver electricity that is vital to health, safety, security, and improved quality of life. GE Vernova is headquartered in Cambridge, Massachusetts, U.S., with approximately 85,000 employees across approximately 100 countries around the world. Supported by the Company’s purpose, The Energy to Change the World, GE Vernova technology helps deliver a more affordable, reliable, sustainable, and secure energy future.
© 2026 GE Vernova and/or its affiliates. All rights reserved.
GE and the GE Monogram are trademarks of General Electric Company used under trademark license.
Investor inquiries
Michael Lapides
GE Vernova | Vice President of Investor Relations
Media inquiries
Adam Tucker
GE Vernova | Director of Financial CommunicationsGE Vernova Completes Prolec GE Acquisition and $2.6B Senior Notes Offering
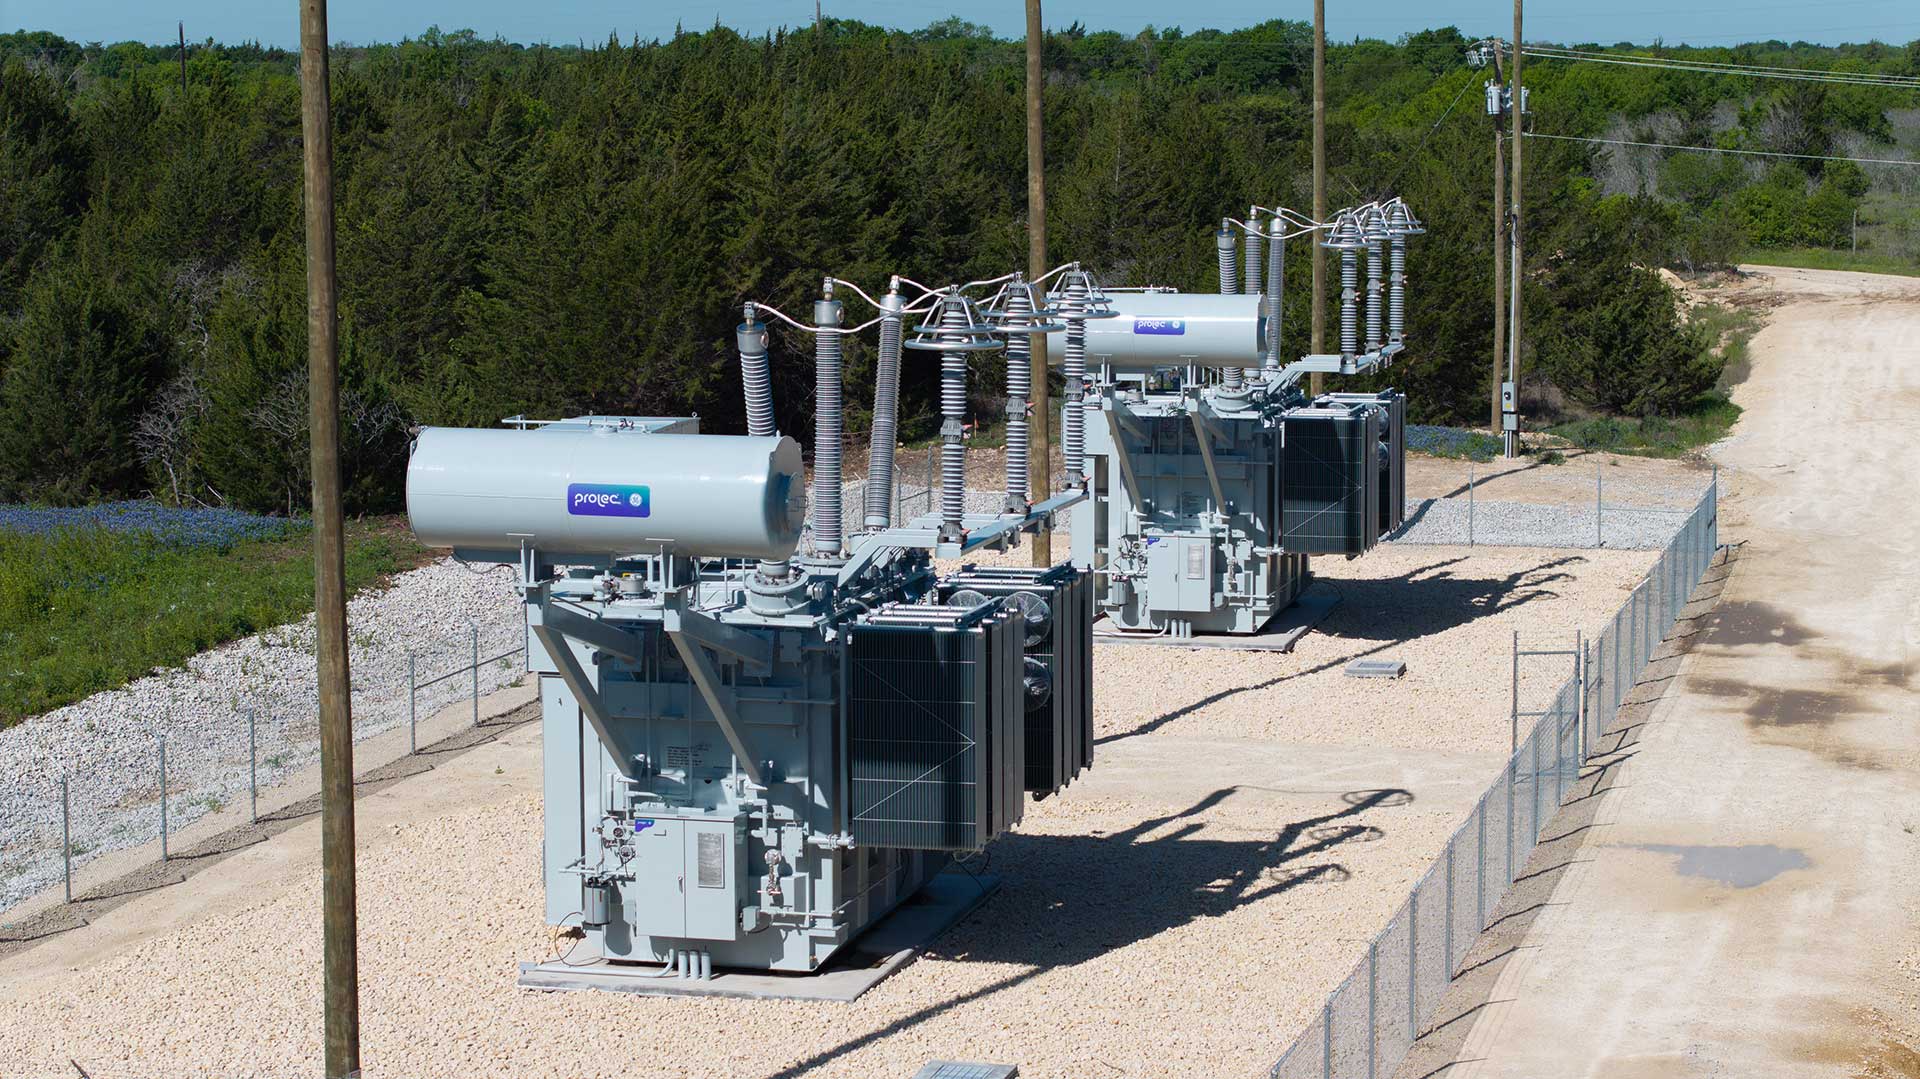
On Monday, February 2, 2026, we announced the completion of our acquisition of the remaining 50% stake of Prolec GE, our former unconsolidated joint venture with Xignux (“Prolec GE”).